Absolute conditional weighted residuals vs covariates for Xpose 4
Source:R/absval.cwres.vs.cov.bw.R
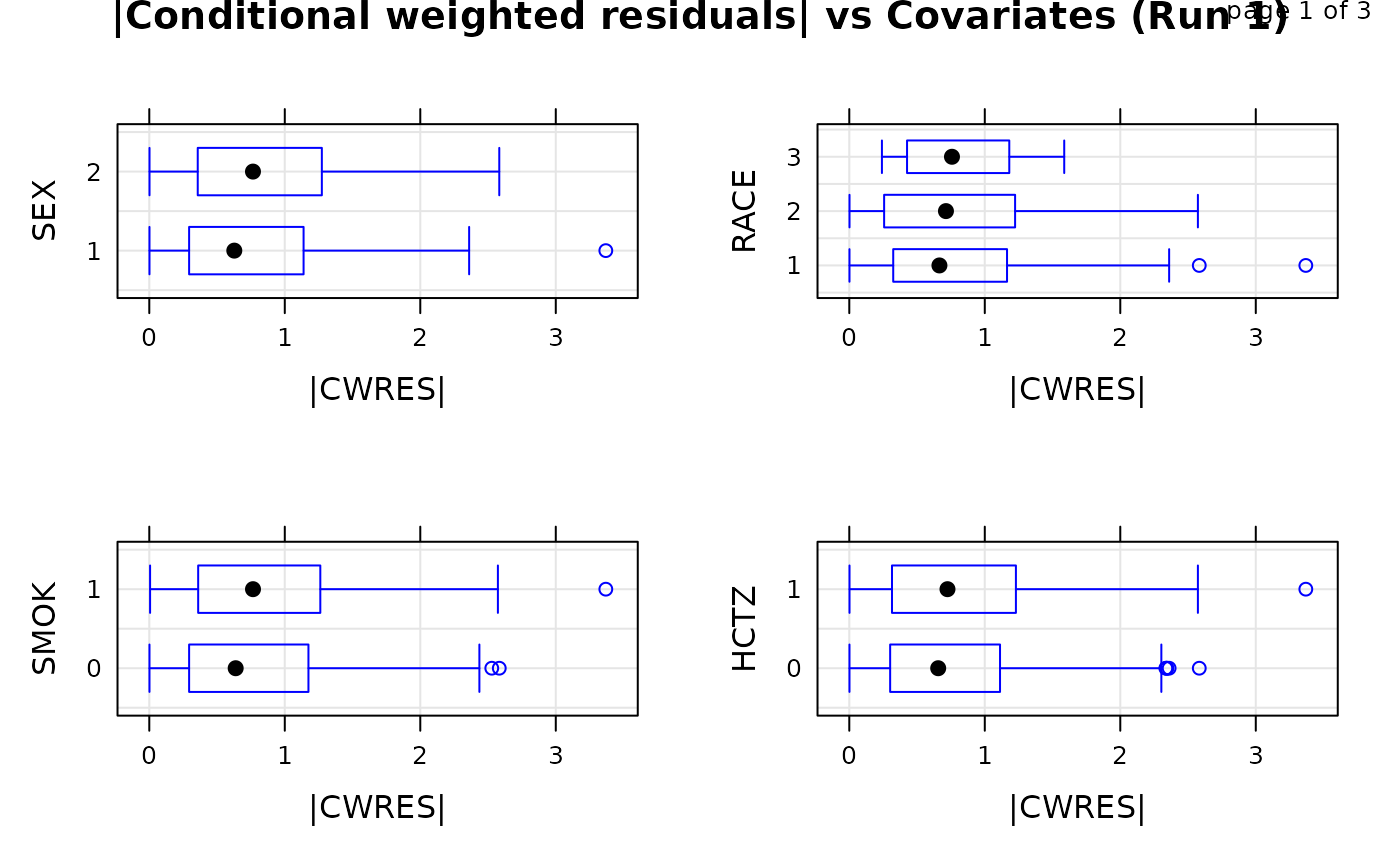
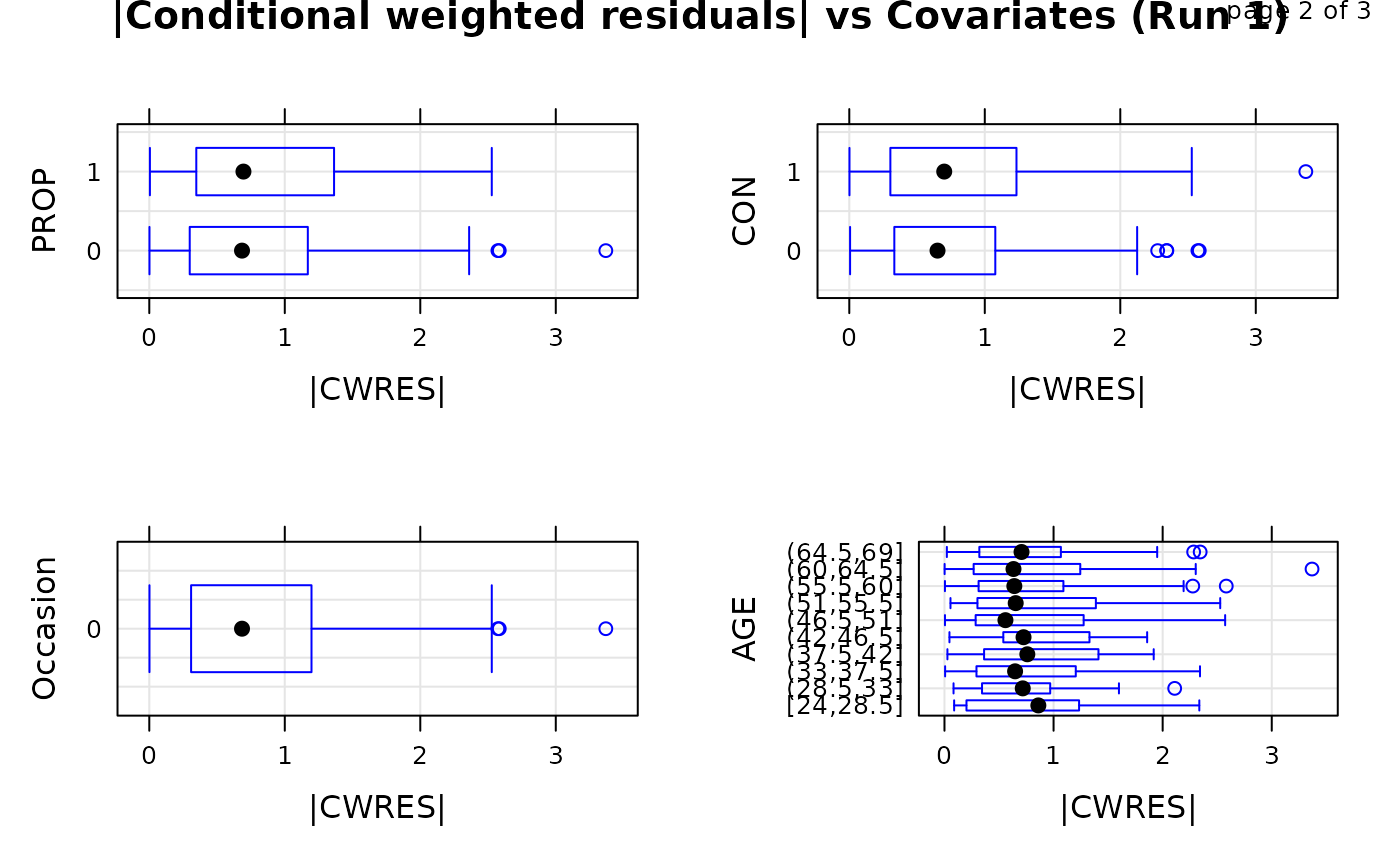
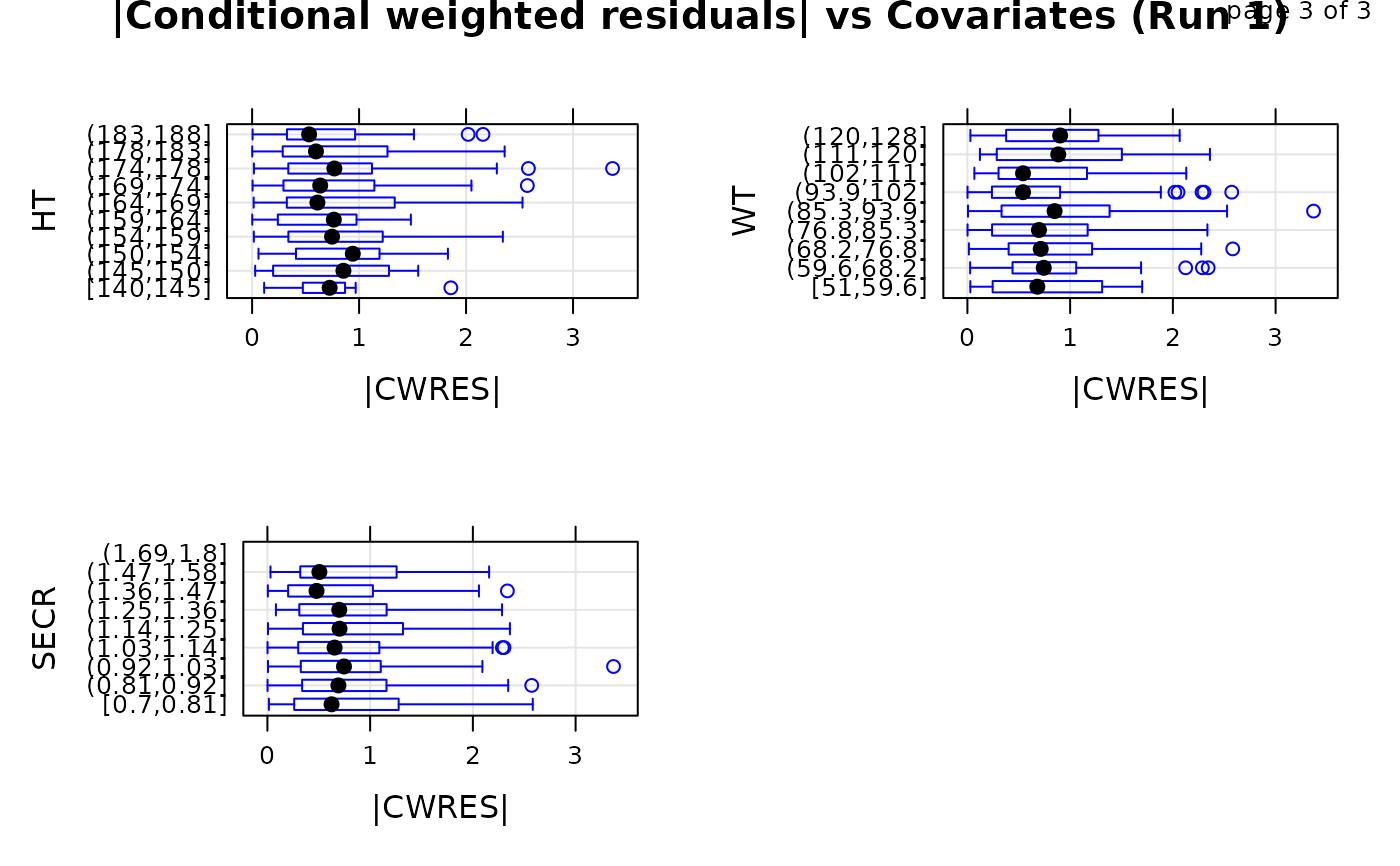
absval.cwres.vs.cov.bw.RdThis creates a stack of box and whisker plot of absolute population conditional weighted residuals (|CWRES|) vs covariates, and is a specific function in Xpose 4. It is a wrapper encapsulating arguments to the codexpose.plot.bw function. Most of the options take their default values from xpose.data object but may be overridden by supplying them as arguments.
Arguments
- object
An xpose.data object.
- xlb
A string giving the label for the x-axis.
NULLif none.- main
The title of the plot. If
"Default"then a default title is plotted. Otherwise the value should be a string like"my title"orNULLfor no plot title.- ...
Other arguments passed to
xpose.plot.bw.
Details
Each of the covariates in the Xpose data object, as specified in
object@Prefs@Xvardef$Covariates, is evaluated in turn, creating a
stack of plots.
Conditional weighted residuals (CWRES) require some extra steps to
calculate. See compute.cwres for details.
A wide array of extra options controlling box-and-whisker plots are
available. See xpose.plot.bw for details.
See also
xpose.plot.bw, xpose.panel.bw,
compute.cwres, bwplot,
xpose.prefs-class, xpose.data-class
Other specific functions:
absval.cwres.vs.pred(),
absval.cwres.vs.pred.by.cov(),
absval.iwres.cwres.vs.ipred.pred(),
absval.iwres.vs.cov.bw(),
absval.iwres.vs.idv(),
absval.iwres.vs.ipred(),
absval.iwres.vs.ipred.by.cov(),
absval.iwres.vs.pred(),
absval.wres.vs.cov.bw(),
absval.wres.vs.idv(),
absval.wres.vs.pred(),
absval.wres.vs.pred.by.cov(),
absval_delta_vs_cov_model_comp,
addit.gof(),
autocorr.cwres(),
autocorr.iwres(),
autocorr.wres(),
basic.gof(),
basic.model.comp(),
cat.dv.vs.idv.sb(),
cat.pc(),
cov.splom(),
cwres.dist.hist(),
cwres.dist.qq(),
cwres.vs.cov(),
cwres.vs.idv(),
cwres.vs.idv.bw(),
cwres.vs.pred(),
cwres.vs.pred.bw(),
cwres.wres.vs.idv(),
cwres.wres.vs.pred(),
dOFV.vs.cov(),
dOFV.vs.id(),
dOFV1.vs.dOFV2(),
data.checkout(),
dv.preds.vs.idv(),
dv.vs.idv(),
dv.vs.ipred(),
dv.vs.ipred.by.cov(),
dv.vs.ipred.by.idv(),
dv.vs.pred(),
dv.vs.pred.by.cov(),
dv.vs.pred.by.idv(),
dv.vs.pred.ipred(),
gof(),
ind.plots(),
ind.plots.cwres.hist(),
ind.plots.cwres.qq(),
ipred.vs.idv(),
iwres.dist.hist(),
iwres.dist.qq(),
iwres.vs.idv(),
kaplan.plot(),
par_cov_hist,
par_cov_qq,
parm.vs.cov(),
parm.vs.parm(),
pred.vs.idv(),
ranpar.vs.cov(),
runsum(),
wres.dist.hist(),
wres.dist.qq(),
wres.vs.idv(),
wres.vs.idv.bw(),
wres.vs.pred(),
wres.vs.pred.bw(),
xpose.VPC(),
xpose.VPC.both(),
xpose.VPC.categorical(),
xpose4-package