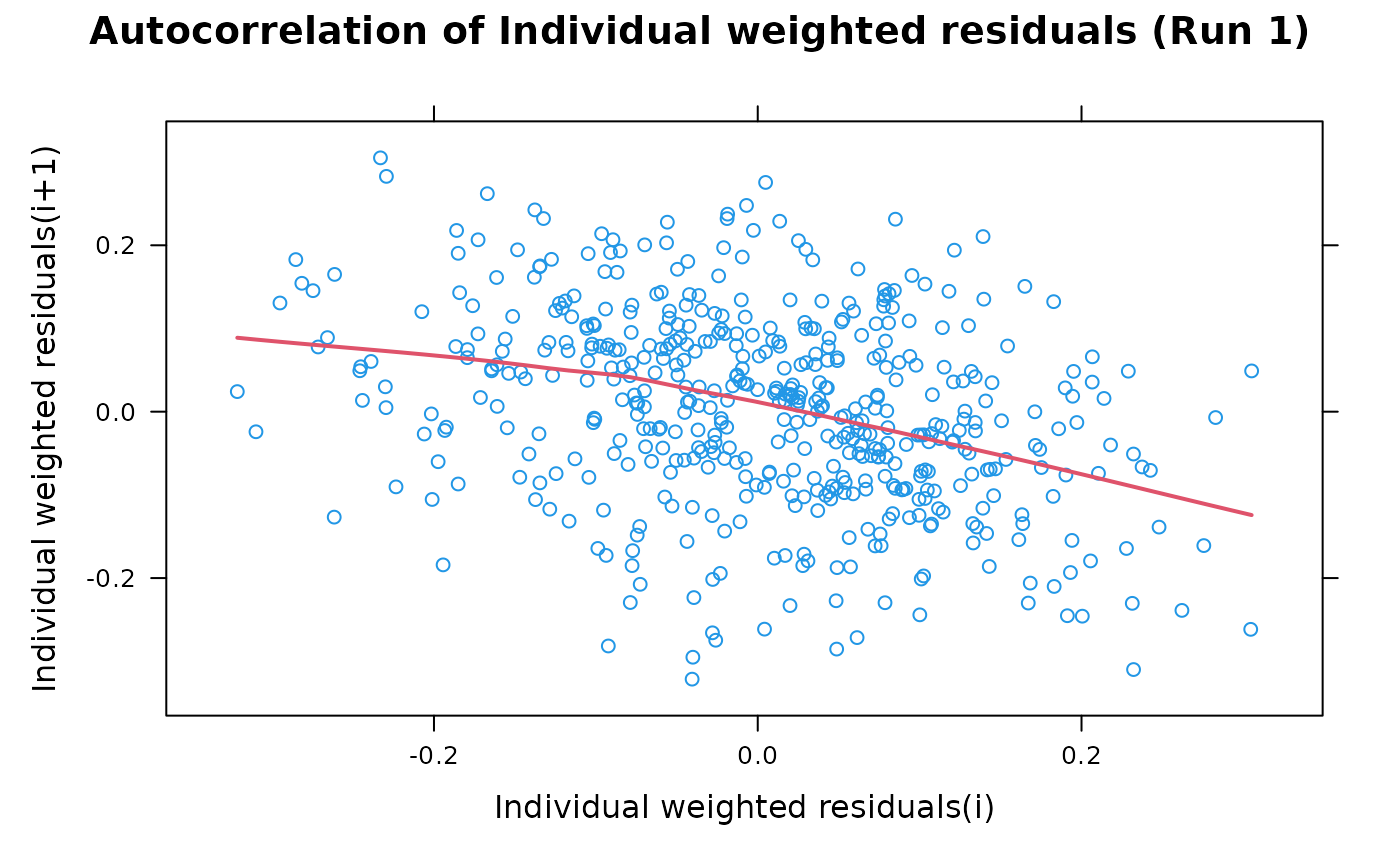
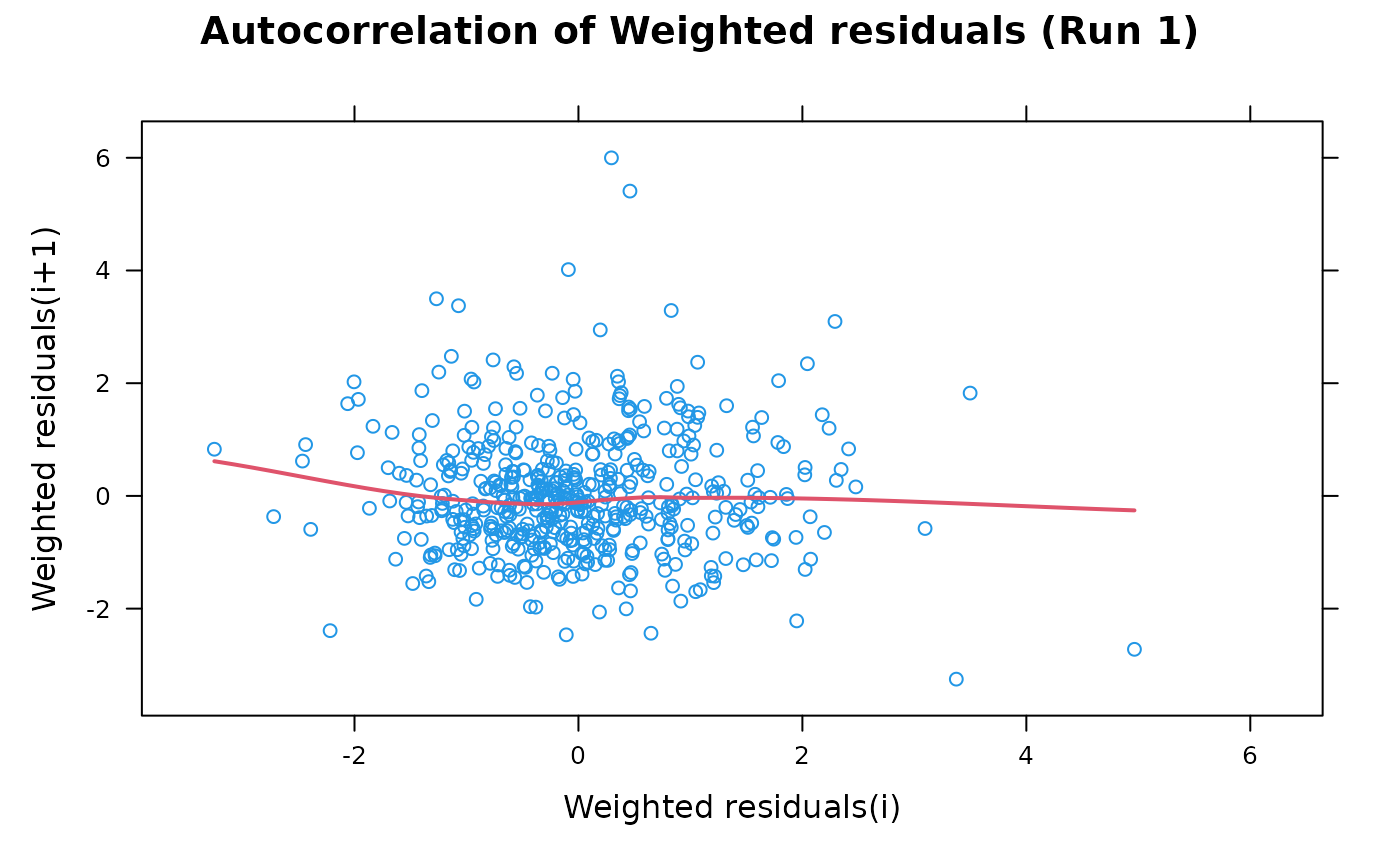
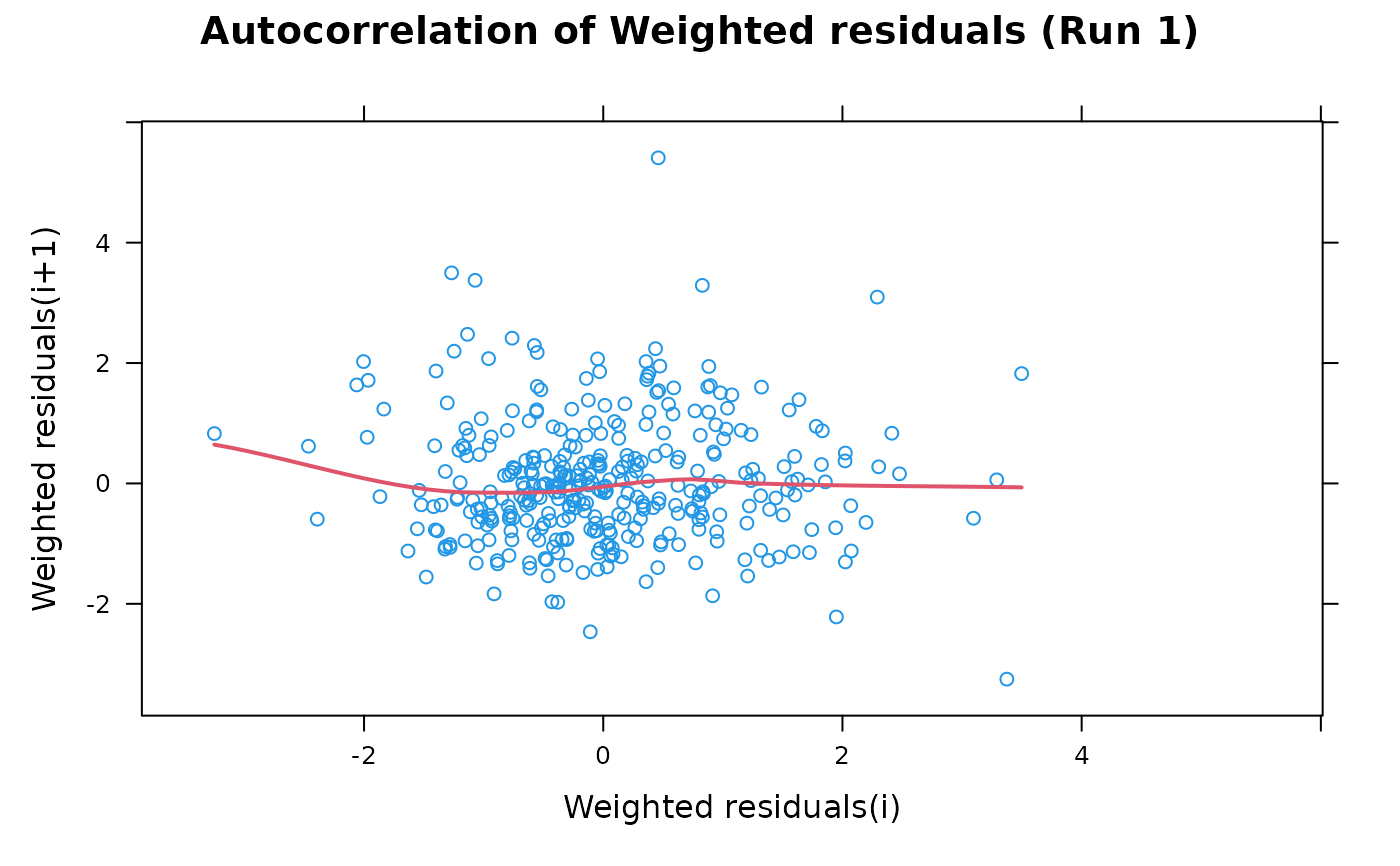
This is an autocorrelation plot of weighted residuals. Most of the options take their default values from the xpose.data object but may be overridden by supplying them as arguments.
Arguments
- object
An xpose.data object.
- type
1-character string giving the type of plot desired. The following values are possible, for details, see
plot: '"p"' for points, '"l"' for lines, '"o"' for over-plotted points and lines, '"b"', '"c"') for (empty if '"c"') points joined by lines, '"s"' and '"S"' for stair steps and '"h"' for histogram-like vertical lines. Finally, '"n"' does not produce any points or lines.- smooth
Logical value indicating whether a smooth should be superimposed.
- ids
A logical value indicating whether text labels should be used as plotting symbols (the variable used for these symbols indicated by the
idlabxpose data variable).- main
The title of the plot. If
"Default"then a default title is plotted. Otherwise the value should be a string like"my title"orNULLfor no plot title.- ...
Other arguments passed to
link{xpose.plot.default}.
Value
Returns an autocorrelation plot for weighted population residuals (WRES) or individual weighted residuals (IWRES).
Details
A wide array of extra options controlling xyplots are available. See
xpose.plot.default for details.
See also
xyplot, xpose.prefs-class,
xpose.data-class
Other specific functions:
absval.cwres.vs.cov.bw(),
absval.cwres.vs.pred(),
absval.cwres.vs.pred.by.cov(),
absval.iwres.cwres.vs.ipred.pred(),
absval.iwres.vs.cov.bw(),
absval.iwres.vs.idv(),
absval.iwres.vs.ipred(),
absval.iwres.vs.ipred.by.cov(),
absval.iwres.vs.pred(),
absval.wres.vs.cov.bw(),
absval.wres.vs.idv(),
absval.wres.vs.pred(),
absval.wres.vs.pred.by.cov(),
absval_delta_vs_cov_model_comp,
addit.gof(),
autocorr.cwres(),
autocorr.iwres(),
basic.gof(),
basic.model.comp(),
cat.dv.vs.idv.sb(),
cat.pc(),
cov.splom(),
cwres.dist.hist(),
cwres.dist.qq(),
cwres.vs.cov(),
cwres.vs.idv(),
cwres.vs.idv.bw(),
cwres.vs.pred(),
cwres.vs.pred.bw(),
cwres.wres.vs.idv(),
cwres.wres.vs.pred(),
dOFV.vs.cov(),
dOFV.vs.id(),
dOFV1.vs.dOFV2(),
data.checkout(),
dv.preds.vs.idv(),
dv.vs.idv(),
dv.vs.ipred(),
dv.vs.ipred.by.cov(),
dv.vs.ipred.by.idv(),
dv.vs.pred(),
dv.vs.pred.by.cov(),
dv.vs.pred.by.idv(),
dv.vs.pred.ipred(),
gof(),
ind.plots(),
ind.plots.cwres.hist(),
ind.plots.cwres.qq(),
ipred.vs.idv(),
iwres.dist.hist(),
iwres.dist.qq(),
iwres.vs.idv(),
kaplan.plot(),
par_cov_hist,
par_cov_qq,
parm.vs.cov(),
parm.vs.parm(),
pred.vs.idv(),
ranpar.vs.cov(),
runsum(),
wres.dist.hist(),
wres.dist.qq(),
wres.vs.idv(),
wres.vs.idv.bw(),
wres.vs.pred(),
wres.vs.pred.bw(),
xpose.VPC(),
xpose.VPC.both(),
xpose.VPC.categorical(),
xpose4-package
Examples
if (FALSE) { # \dontrun{
## We expect to find the required NONMEM run and table files for run
## 5 in the current working directory
xpdb5 <- xpose.data(5)
} # }
## Here we load the example xpose database
data(simpraz.xpdb)
xpdb <- simpraz.xpdb
## A vanilla plot
autocorr.wres(xpdb)
 ## A conditioning plot
autocorr.wres(xpdb, dilution=TRUE)
## A conditioning plot
autocorr.wres(xpdb, dilution=TRUE)
 ## Custom heading and axis labels
autocorr.wres(xpdb, main="My conditioning plot", ylb="|CWRES|", xlb="PRED")
## Custom heading and axis labels
autocorr.wres(xpdb, main="My conditioning plot", ylb="|CWRES|", xlb="PRED")
 ## Custom colours and symbols, IDs
autocorr.wres(xpdb, cex=0.6, pch=3, col=1, ids=TRUE)
## Custom colours and symbols, IDs
autocorr.wres(xpdb, cex=0.6, pch=3, col=1, ids=TRUE)
 ## A vanilla plot with IWRES
autocorr.iwres(xpdb)
## A vanilla plot with IWRES
autocorr.iwres(xpdb)