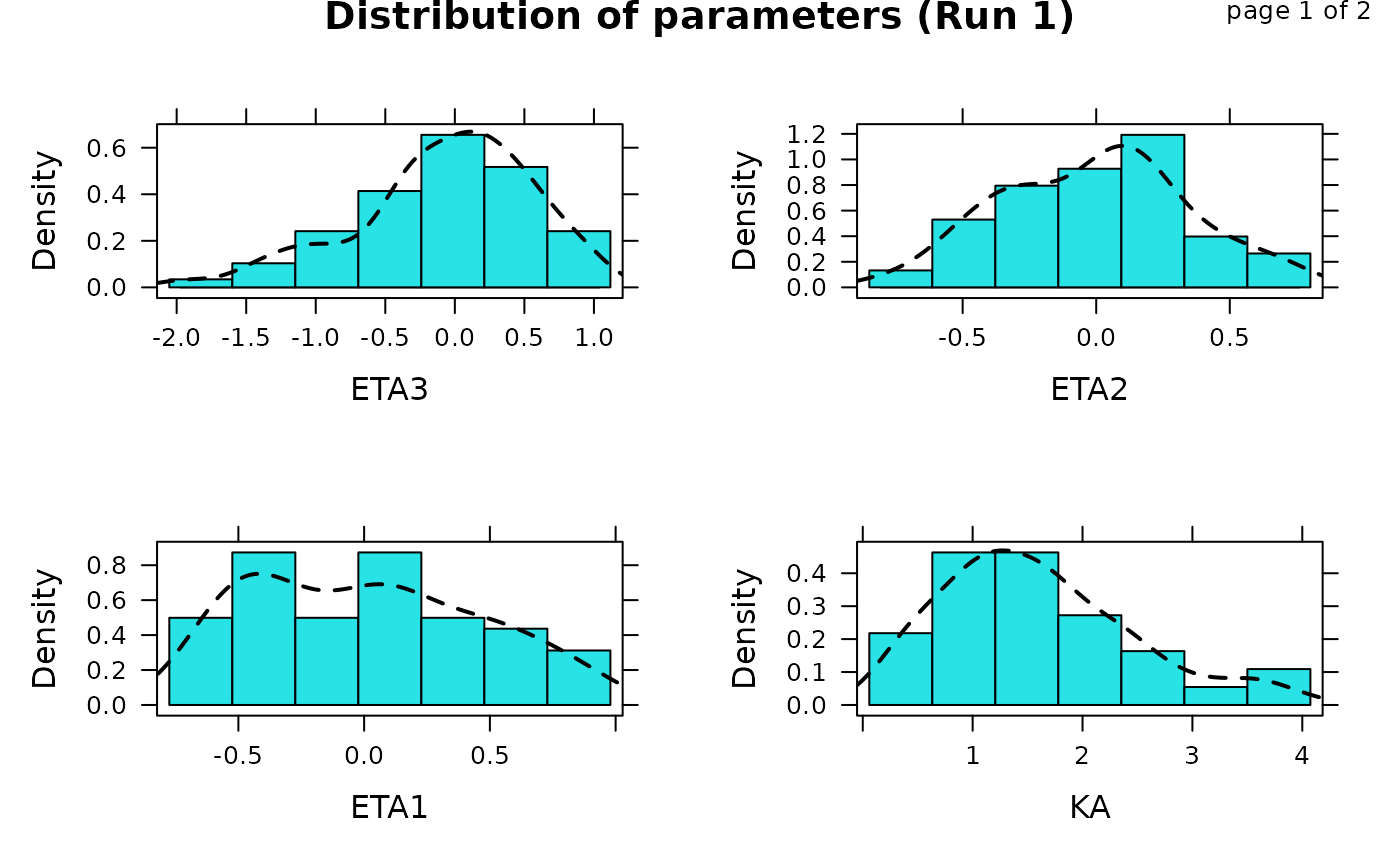
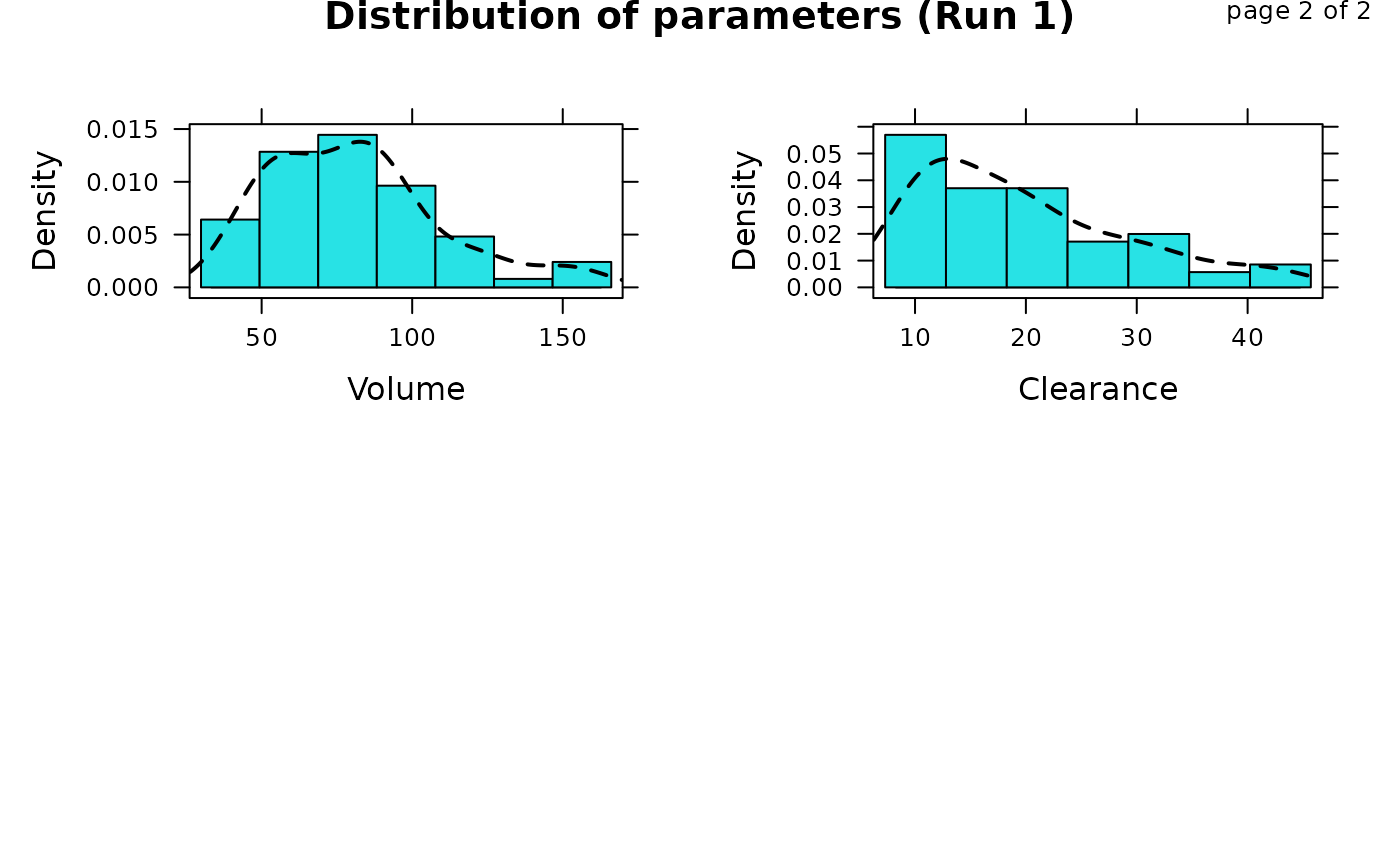
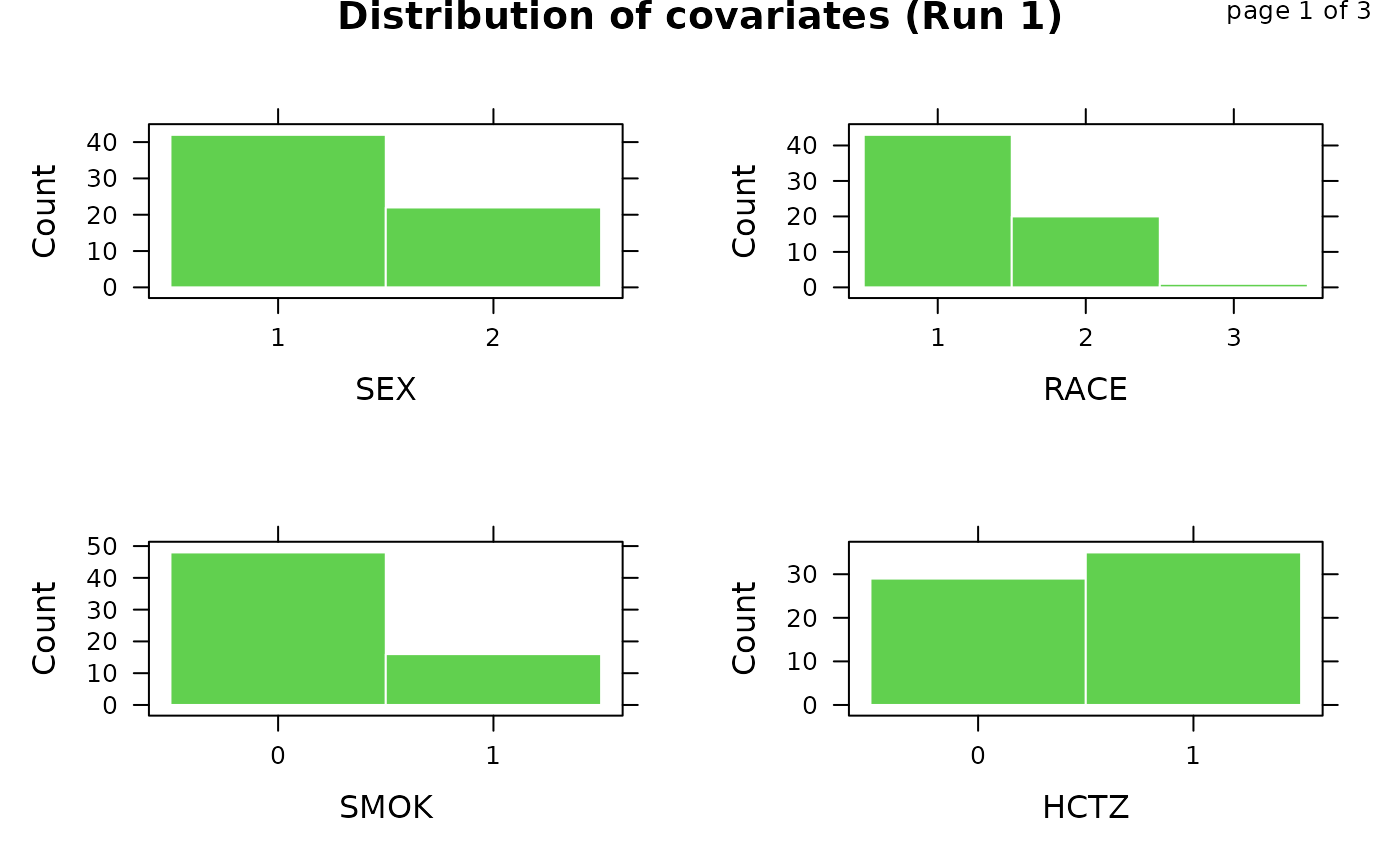
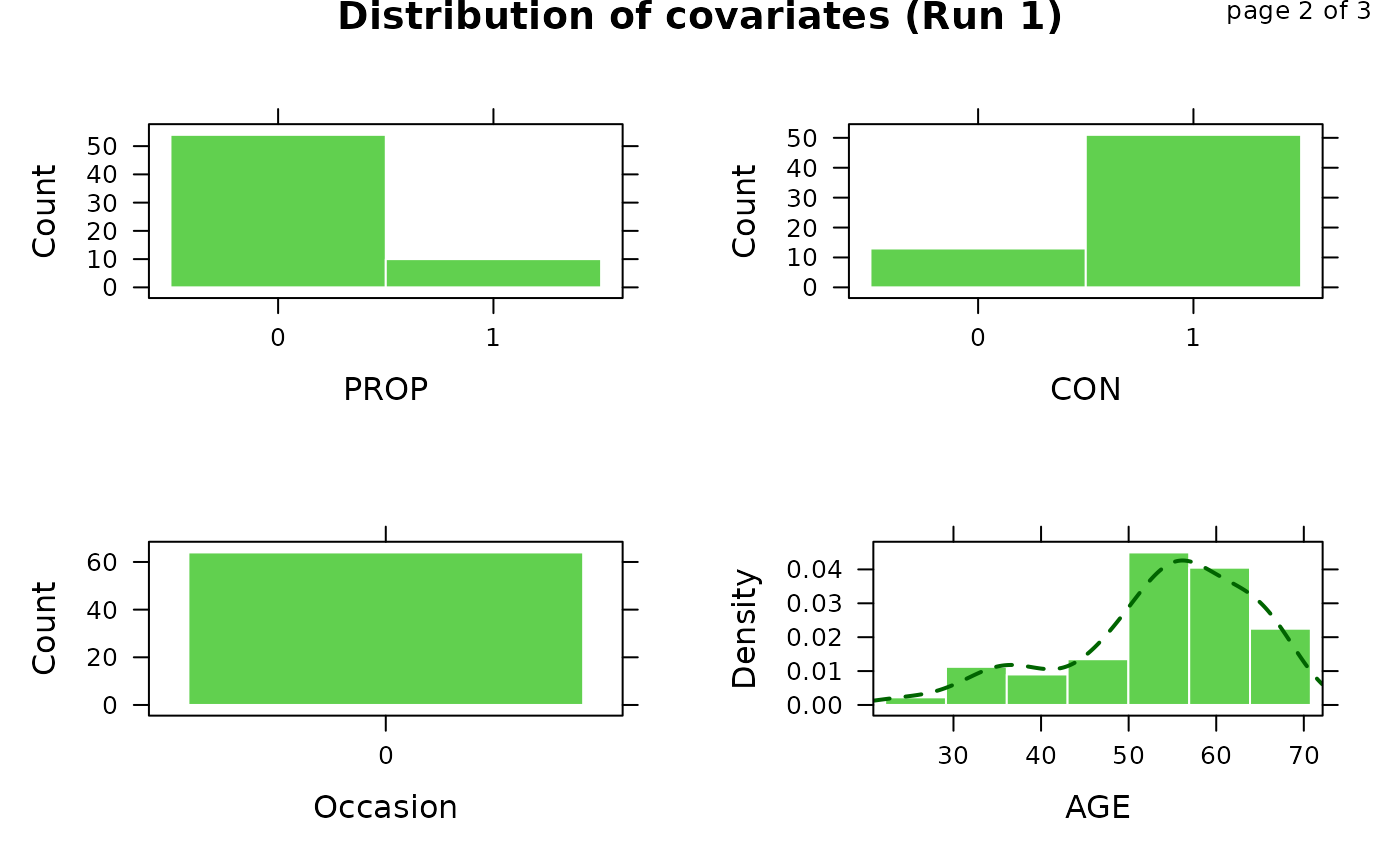
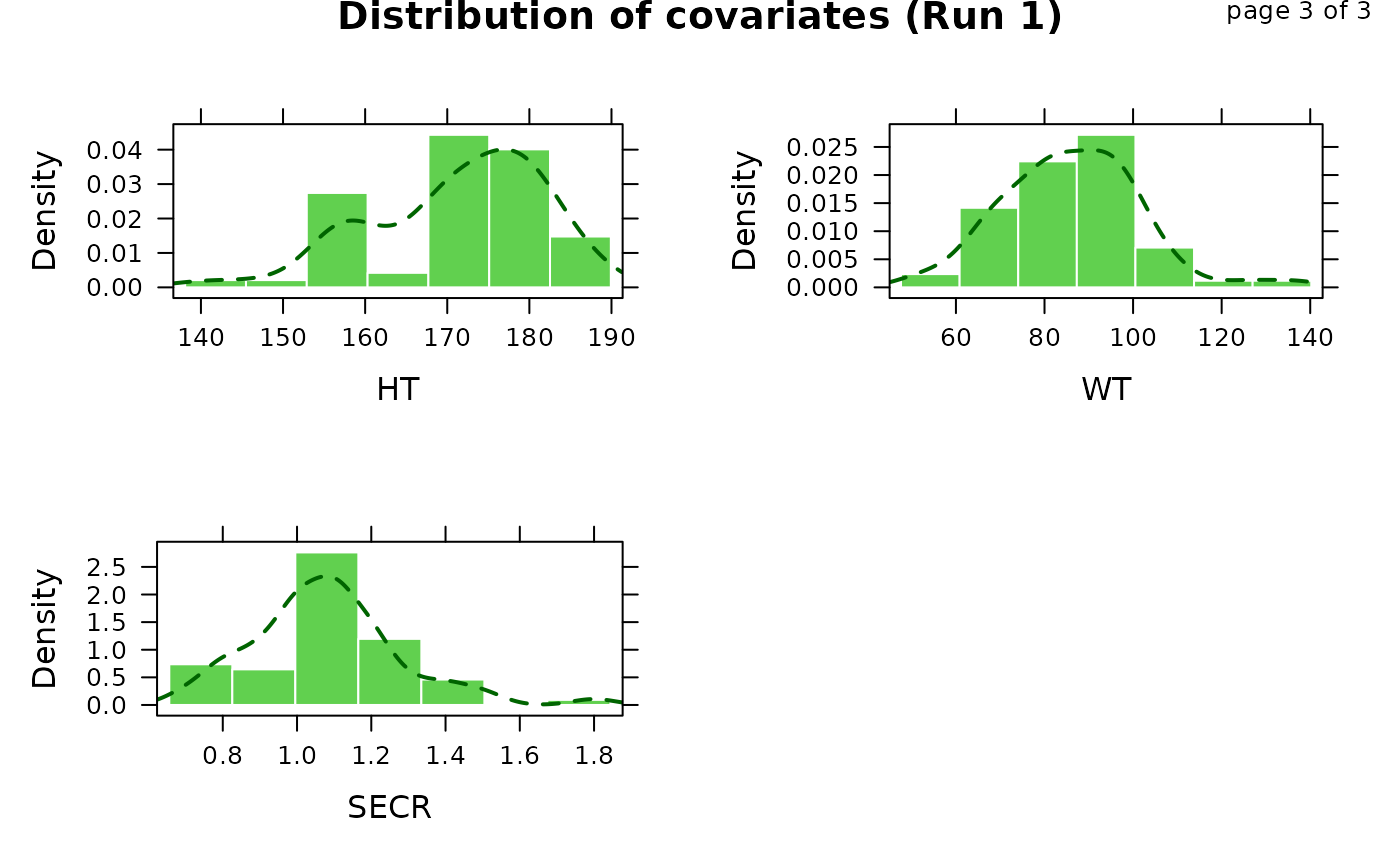
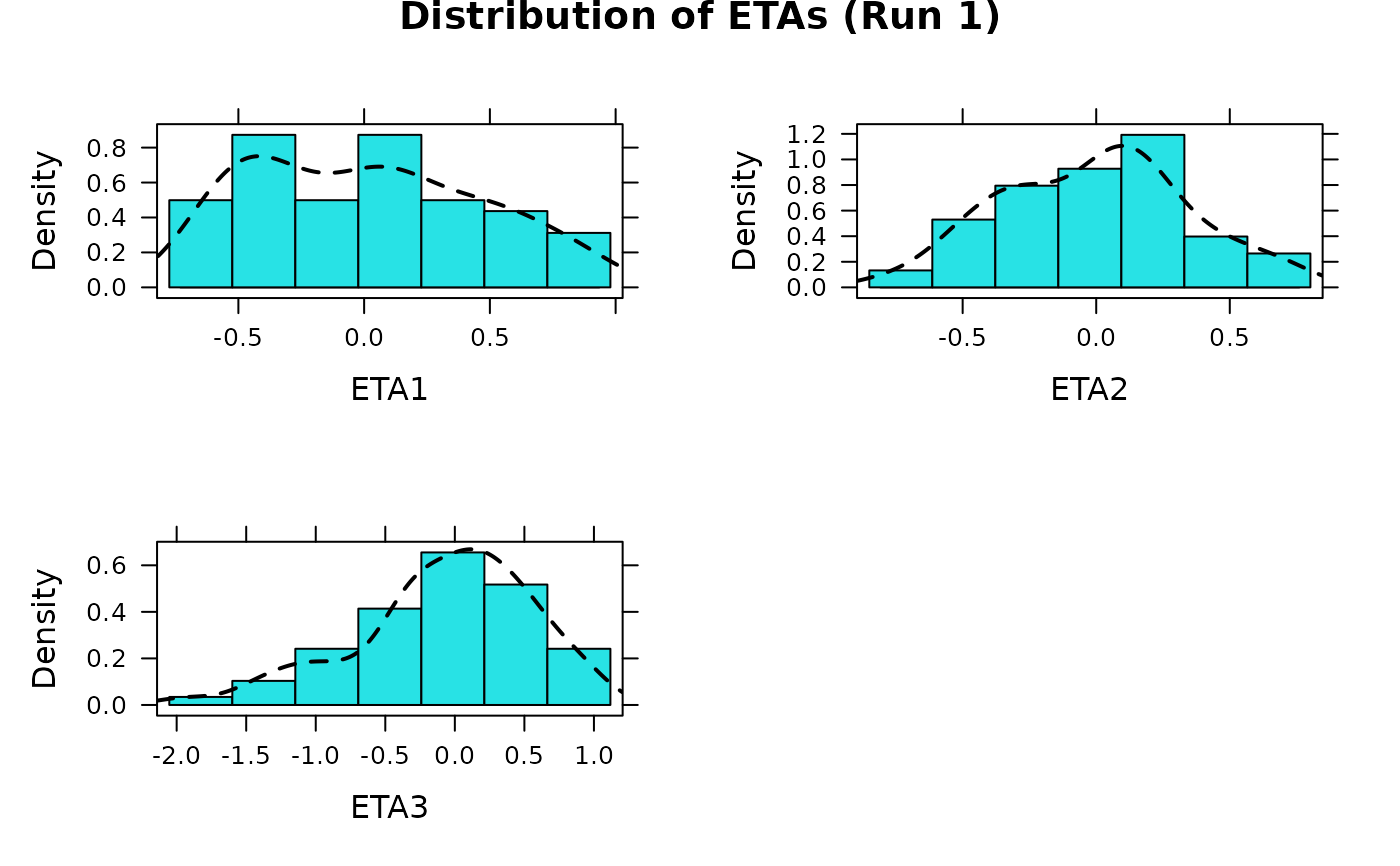
Plot the parameter or covariate distributions using a histogram
Source:R/cov.hist.R, R/parm.hist.R, R/ranpar.hist.R
par_cov_hist.RdThese functions plot the parameter or covariate values stored in an Xpose data object using histograms.
Usage
cov.hist(object, onlyfirst = TRUE, main = "Default", ...)

parm.hist(object, onlyfirst = TRUE, main = "Default", ...)

ranpar.hist(object, onlyfirst = TRUE, main = "Default", ...)
Arguments
- object
An xpose.data object.
- onlyfirst
Logical value indicating if only the first row per individual is included in the plot.
- main
The title of the plot. If
"Default"then a default title is plotted. Otherwise the value should be a string like"my title"orNULLfor no plot title.- ...
Other arguments passed to
xpose.plot.histogram.
Details
Each of the parameters or covariates in the Xpose data object, as specified
in object@Prefs@Xvardef$parms, object@Prefs@Xvardef$covariates
or object@Prefs@Xvardef$ranpar is evaluated in turn, creating a stack
of histograms.
A wide array of extra options controlling histograms are available. See
xpose.plot.histogram for details.
Functions
cov.hist(): Covariate distributionsparm.hist(): parameter distributionsranpar.hist(): random parameter distributions
See also
xpose.plot.histogram,
xpose.panel.histogram, histogram,
xpose.data-class, xpose.prefs-class
Other specific functions:
absval.cwres.vs.cov.bw(),
absval.cwres.vs.pred(),
absval.cwres.vs.pred.by.cov(),
absval.iwres.cwres.vs.ipred.pred(),
absval.iwres.vs.cov.bw(),
absval.iwres.vs.idv(),
absval.iwres.vs.ipred(),
absval.iwres.vs.ipred.by.cov(),
absval.iwres.vs.pred(),
absval.wres.vs.cov.bw(),
absval.wres.vs.idv(),
absval.wres.vs.pred(),
absval.wres.vs.pred.by.cov(),
absval_delta_vs_cov_model_comp,
addit.gof(),
autocorr.cwres(),
autocorr.iwres(),
autocorr.wres(),
basic.gof(),
basic.model.comp(),
cat.dv.vs.idv.sb(),
cat.pc(),
cov.splom(),
cwres.dist.hist(),
cwres.dist.qq(),
cwres.vs.cov(),
cwres.vs.idv(),
cwres.vs.idv.bw(),
cwres.vs.pred(),
cwres.vs.pred.bw(),
cwres.wres.vs.idv(),
cwres.wres.vs.pred(),
dOFV.vs.cov(),
dOFV.vs.id(),
dOFV1.vs.dOFV2(),
data.checkout(),
dv.preds.vs.idv(),
dv.vs.idv(),
dv.vs.ipred(),
dv.vs.ipred.by.cov(),
dv.vs.ipred.by.idv(),
dv.vs.pred(),
dv.vs.pred.by.cov(),
dv.vs.pred.by.idv(),
dv.vs.pred.ipred(),
gof(),
ind.plots(),
ind.plots.cwres.hist(),
ind.plots.cwres.qq(),
ipred.vs.idv(),
iwres.dist.hist(),
iwres.dist.qq(),
iwres.vs.idv(),
kaplan.plot(),
par_cov_qq,
parm.vs.cov(),
parm.vs.parm(),
pred.vs.idv(),
ranpar.vs.cov(),
runsum(),
wres.dist.hist(),
wres.dist.qq(),
wres.vs.idv(),
wres.vs.idv.bw(),
wres.vs.pred(),
wres.vs.pred.bw(),
xpose.VPC(),
xpose.VPC.both(),
xpose.VPC.categorical(),
xpose4-package