Quantile-quantile plots of weighted residuals for each individual in an Xpose data object, for Xpose 4
Source:R/ind.plots.cwres.qq.R, R/ind.plots.wres.qq.R
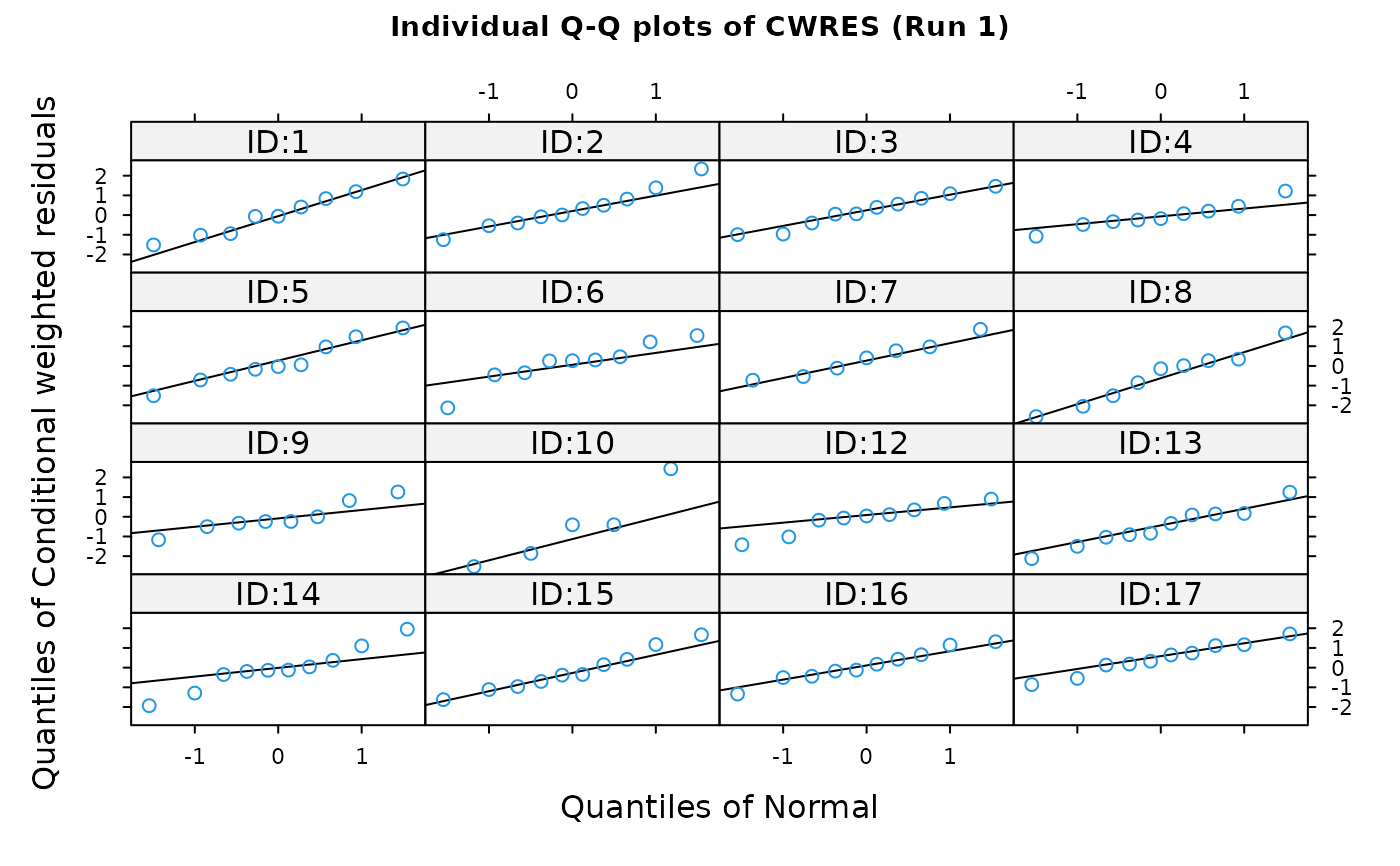
ind.plots.wres.qq.RdThis is a compound plot consisting of QQ plots of the distribution of
weighted residuals (any weighted residual produced by NONMEM) for every
individual in the dataset. The function is a wrapper encapsulating
arguments to the xpose.plot.qq function.
Usage
ind.plots.cwres.qq(object, wres = "cwres", ...)

ind.plots.wres.qq(
  object,
  main = "Default",
  wres = "wres",
  layout = c(4, 4),
  inclZeroWRES = FALSE,
  subset = xsubset(object),
  scales = list(cex = 0.7, tck = 0.5),
  aspect = "fill",
  force.by.factor = TRUE,
  ids = F,
  as.table = TRUE,
  type = "o",
  pch = object@Prefs@Graph.prefs$pch,
  col = object@Prefs@Graph.prefs$col,
  cex = object@Prefs@Graph.prefs$cex,
  abllty = object@Prefs@Graph.prefs$abllty,
  abllwd = object@Prefs@Graph.prefs$abllwd,
  ablcol = object@Prefs@Graph.prefs$ablcol,
  prompt = FALSE,
  main.cex = 0.9,
  mirror = NULL,
  max.plots.per.page = 1,
  ...
)
Arguments
- object
An xpose.data object.
- wres
Which weighted residual should we plot? Defaults to the WRES.
- ...
Other arguments passed to
link{xpose.plot.qq}.- main
The title of the plot. If
"Default"then a default title is plotted. Otherwise the value should be a string like"my title"orNULLfor no plot title.- layout
A list giving the layout of the graphs on the plot, in columns and rows. The default is 4x4.
- inclZeroWRES
Logical value indicating whether rows with WRES=0 is included in the plot. The default is FALSE.
- subset
A string giving the subset expression to be applied to the data before plotting. See
xsubset.- scales
See
xpose.plot.qq.- aspect
See
xpose.plot.qq.- force.by.factor
See
xpose.plot.qq.- ids
See
xpose.plot.qq.- as.table
See
xpose.plot.qq.- type
1-character string giving the type of plot desired. The following values are possible, for details, see 'plot': '"p"' for points, '"l"' for lines, '"o"' for over-plotted points and lines, '"b"', '"c"') for (empty if '"c"') points joined by lines, '"s"' and '"S"' for stair steps and '"h"' for histogram-like vertical lines. Finally, '"n"' does not produce any points or lines.
- pch
The plotting character, or symbol, to use. Specified as an integer. See R help on
points. The default is an open circle.- col
The color for lines and points. Specified as an integer or a text string. A full list is obtained by the R command
colours(). The default is blue (col=4).- cex
The amount by which plotting text and symbols should be scaled relative to the default. 'NULL' and 'NA' are equivalent to '1.0'.
- abllty
Line type of the line of identity.
- abllwd
Line width of the line of identity.
- ablcol
Line colour of the line of identity.
- prompt
Specifies whether or not the user should be prompted to press RETURN between plot pages. Default is FALSE.
- main.cex
The size of the title.
- mirror
Mirror plots are not yet implemented in this function and this argument must contain a value of
NULL- max.plots.per.page
Maximum number of plots per page
Details
Matrices of Q-Q plots of weighted residuals in each included individual are displayed.
A wide array of extra options controlling Q-Q plots are available. See
xpose.plot.qq for details.
See also
xpose.plot.qq, xpose.panel.qq,
qqplot, qqmath,
xpose.prefs-class, xpose.data-class
Other specific functions:
absval.cwres.vs.cov.bw(),
absval.cwres.vs.pred(),
absval.cwres.vs.pred.by.cov(),
absval.iwres.cwres.vs.ipred.pred(),
absval.iwres.vs.cov.bw(),
absval.iwres.vs.idv(),
absval.iwres.vs.ipred(),
absval.iwres.vs.ipred.by.cov(),
absval.iwres.vs.pred(),
absval.wres.vs.cov.bw(),
absval.wres.vs.idv(),
absval.wres.vs.pred(),
absval.wres.vs.pred.by.cov(),
absval_delta_vs_cov_model_comp,
addit.gof(),
autocorr.cwres(),
autocorr.iwres(),
autocorr.wres(),
basic.gof(),
basic.model.comp(),
cat.dv.vs.idv.sb(),
cat.pc(),
cov.splom(),
cwres.dist.hist(),
cwres.dist.qq(),
cwres.vs.cov(),
cwres.vs.idv(),
cwres.vs.idv.bw(),
cwres.vs.pred(),
cwres.vs.pred.bw(),
cwres.wres.vs.idv(),
cwres.wres.vs.pred(),
dOFV.vs.cov(),
dOFV.vs.id(),
dOFV1.vs.dOFV2(),
data.checkout(),
dv.preds.vs.idv(),
dv.vs.idv(),
dv.vs.ipred(),
dv.vs.ipred.by.cov(),
dv.vs.ipred.by.idv(),
dv.vs.pred(),
dv.vs.pred.by.cov(),
dv.vs.pred.by.idv(),
dv.vs.pred.ipred(),
gof(),
ind.plots(),
ind.plots.cwres.hist(),
ipred.vs.idv(),
iwres.dist.hist(),
iwres.dist.qq(),
iwres.vs.idv(),
kaplan.plot(),
par_cov_hist,
par_cov_qq,
parm.vs.cov(),
parm.vs.parm(),
pred.vs.idv(),
ranpar.vs.cov(),
runsum(),
wres.dist.hist(),
wres.dist.qq(),
wres.vs.idv(),
wres.vs.idv.bw(),
wres.vs.pred(),
wres.vs.pred.bw(),
xpose.VPC(),
xpose.VPC.both(),
xpose.VPC.categorical(),
xpose4-package