Autocorrelation of conditional weighted residuals for Xpose 4
Source:R/autocorr.cwres.R
autocorr.cwres.RdThis is an autocorrelation plot of conditional weighted residuals, a specific function in Xpose 4. Most of the options take their default values from xpose.data object but may be overridden by supplying them as arguments.
Arguments
- object
An xpose.data object.
- type
1-character string giving the type of plot desired. The following values are possible, for details, see
plot: '"p"' for points, '"l"' for lines, '"o"' for over-plotted points and lines, '"b"', '"c"') for (empty if '"c"') points joined by lines, '"s"' and '"S"' for stair steps and '"h"' for histogram-like vertical lines. Finally, '"n"' does not produce any points or lines.- smooth
Logical value indicating whether a smooth should be superimposed.
- ids
A logical value indicating whether text labels should be used as plotting symbols (the variable used for these symbols indicated by the
idlabxpose data variable).- main
The title of the plot. If
"Default"then a default title is plotted. Otherwise the value should be a string like"my title"orNULLfor no plot title.- ...
Other arguments passed to
link{xpose.plot.default}.
Details
A wide array of extra options controlling xyplots are available. See
xpose.plot.default for details.
Conditional weighted residuals (CWRES) require some extra steps to
calculate. See compute.cwres for details.
See also
xyplot, xpose.prefs-class,
compute.cwres, xpose.data-class
Other specific functions:
absval.cwres.vs.cov.bw(),
absval.cwres.vs.pred(),
absval.cwres.vs.pred.by.cov(),
absval.iwres.cwres.vs.ipred.pred(),
absval.iwres.vs.cov.bw(),
absval.iwres.vs.idv(),
absval.iwres.vs.ipred(),
absval.iwres.vs.ipred.by.cov(),
absval.iwres.vs.pred(),
absval.wres.vs.cov.bw(),
absval.wres.vs.idv(),
absval.wres.vs.pred(),
absval.wres.vs.pred.by.cov(),
absval_delta_vs_cov_model_comp,
addit.gof(),
autocorr.iwres(),
autocorr.wres(),
basic.gof(),
basic.model.comp(),
cat.dv.vs.idv.sb(),
cat.pc(),
cov.splom(),
cwres.dist.hist(),
cwres.dist.qq(),
cwres.vs.cov(),
cwres.vs.idv(),
cwres.vs.idv.bw(),
cwres.vs.pred(),
cwres.vs.pred.bw(),
cwres.wres.vs.idv(),
cwres.wres.vs.pred(),
dOFV.vs.cov(),
dOFV.vs.id(),
dOFV1.vs.dOFV2(),
data.checkout(),
dv.preds.vs.idv(),
dv.vs.idv(),
dv.vs.ipred(),
dv.vs.ipred.by.cov(),
dv.vs.ipred.by.idv(),
dv.vs.pred(),
dv.vs.pred.by.cov(),
dv.vs.pred.by.idv(),
dv.vs.pred.ipred(),
gof(),
ind.plots(),
ind.plots.cwres.hist(),
ind.plots.cwres.qq(),
ipred.vs.idv(),
iwres.dist.hist(),
iwres.dist.qq(),
iwres.vs.idv(),
kaplan.plot(),
par_cov_hist,
par_cov_qq,
parm.vs.cov(),
parm.vs.parm(),
pred.vs.idv(),
ranpar.vs.cov(),
runsum(),
wres.dist.hist(),
wres.dist.qq(),
wres.vs.idv(),
wres.vs.idv.bw(),
wres.vs.pred(),
wres.vs.pred.bw(),
xpose.VPC(),
xpose.VPC.both(),
xpose.VPC.categorical(),
xpose4-package
Examples
if (FALSE) { # \dontrun{
## We expect to find the required NONMEM run and table files for run
## 5 in the current working directory
xpdb5 <- xpose.data(5)
} # }
## Here we load the example xpose database
data(simpraz.xpdb)
xpdb <- simpraz.xpdb
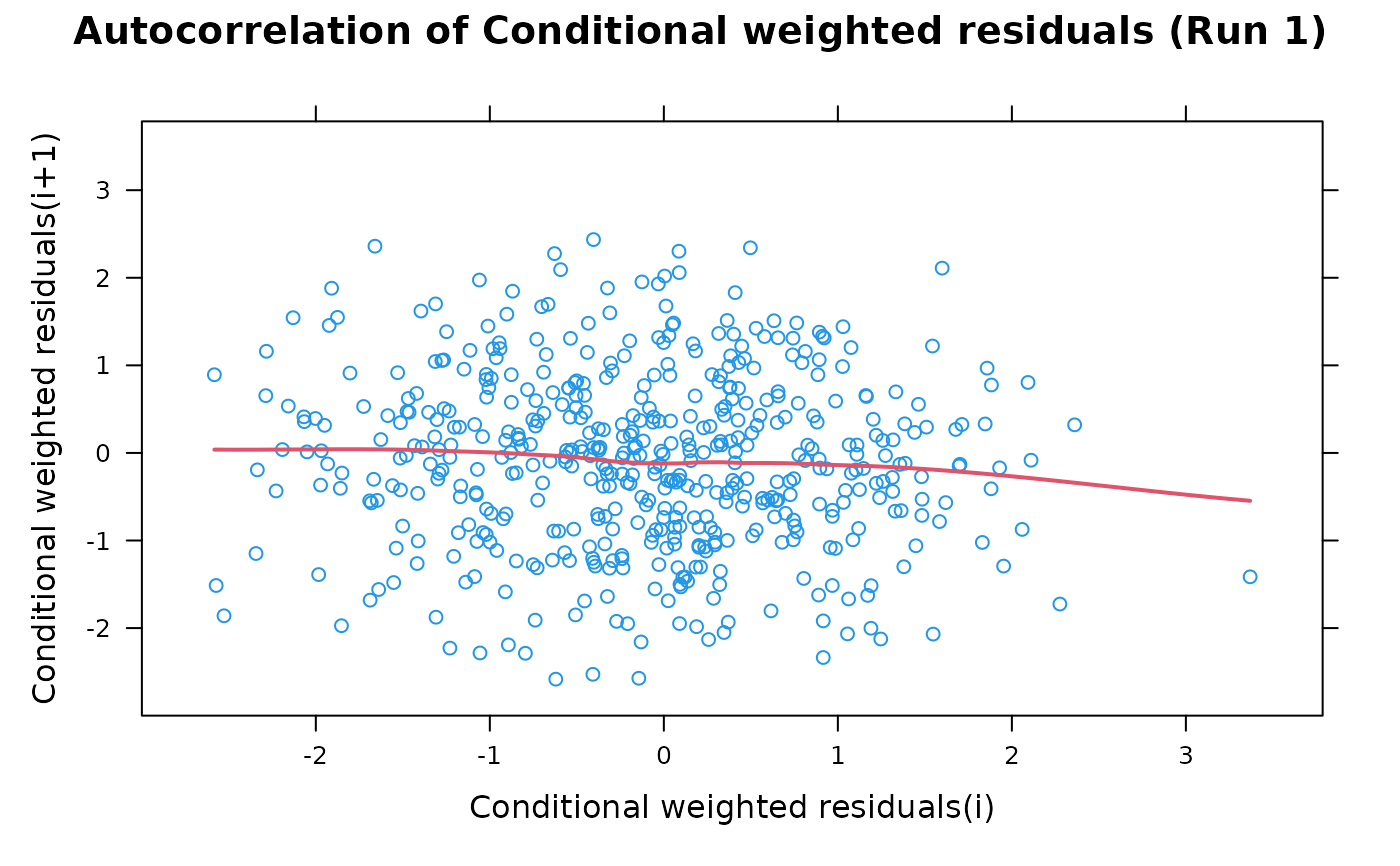
## A vanilla plot
autocorr.cwres(xpdb)
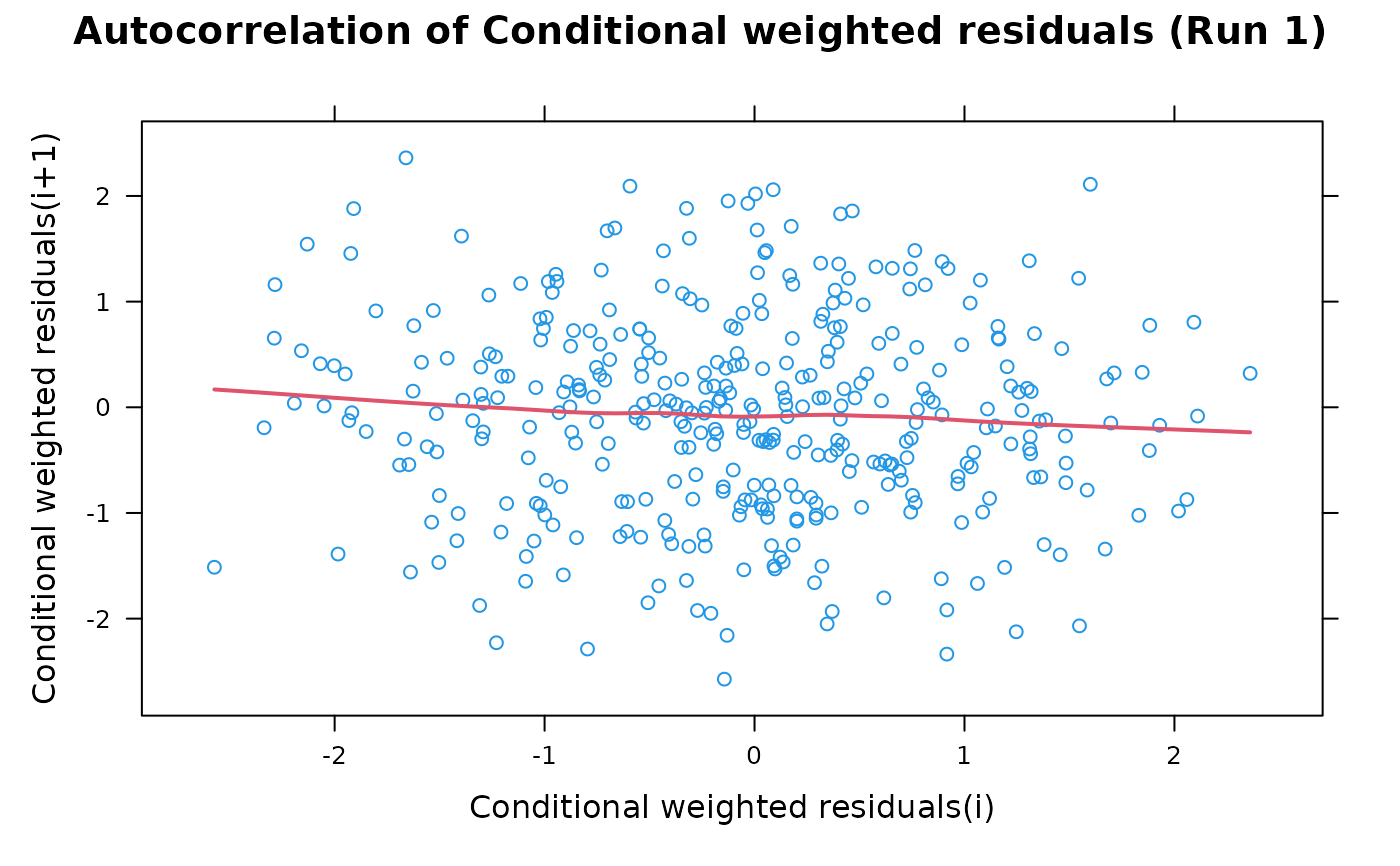
 ## A conditioning plot
autocorr.cwres(xpdb, dilution=TRUE)
## A conditioning plot
autocorr.cwres(xpdb, dilution=TRUE)
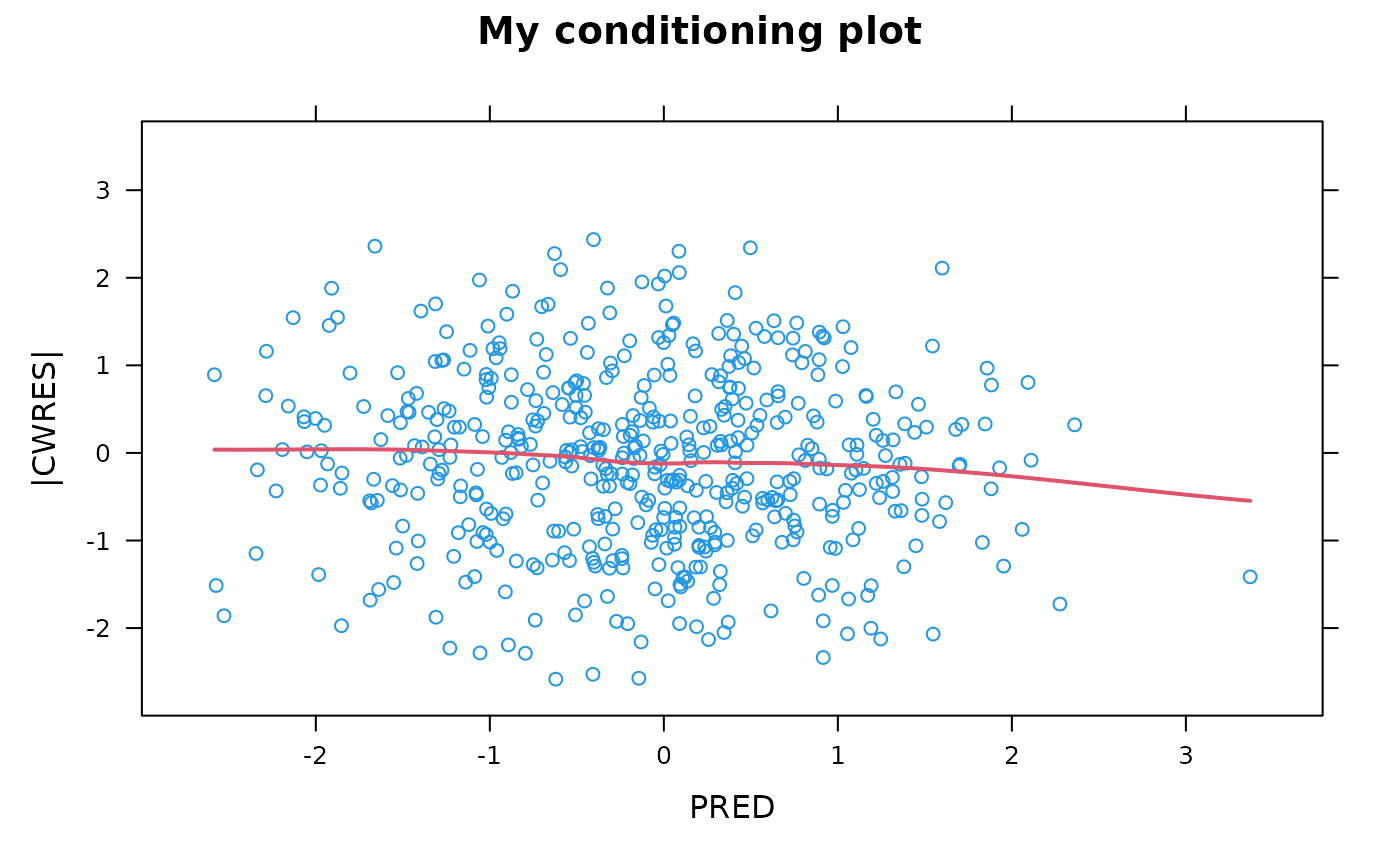
 ## Custom heading and axis labels
autocorr.cwres(xpdb, main="My conditioning plot", ylb="|CWRES|", xlb="PRED")
## Custom heading and axis labels
autocorr.cwres(xpdb, main="My conditioning plot", ylb="|CWRES|", xlb="PRED")
 ## Custom colours and symbols, IDs
autocorr.cwres(xpdb, cex=0.6, pch=3, col=1, ids=TRUE)
## Custom colours and symbols, IDs
autocorr.cwres(xpdb, cex=0.6, pch=3, col=1, ids=TRUE)