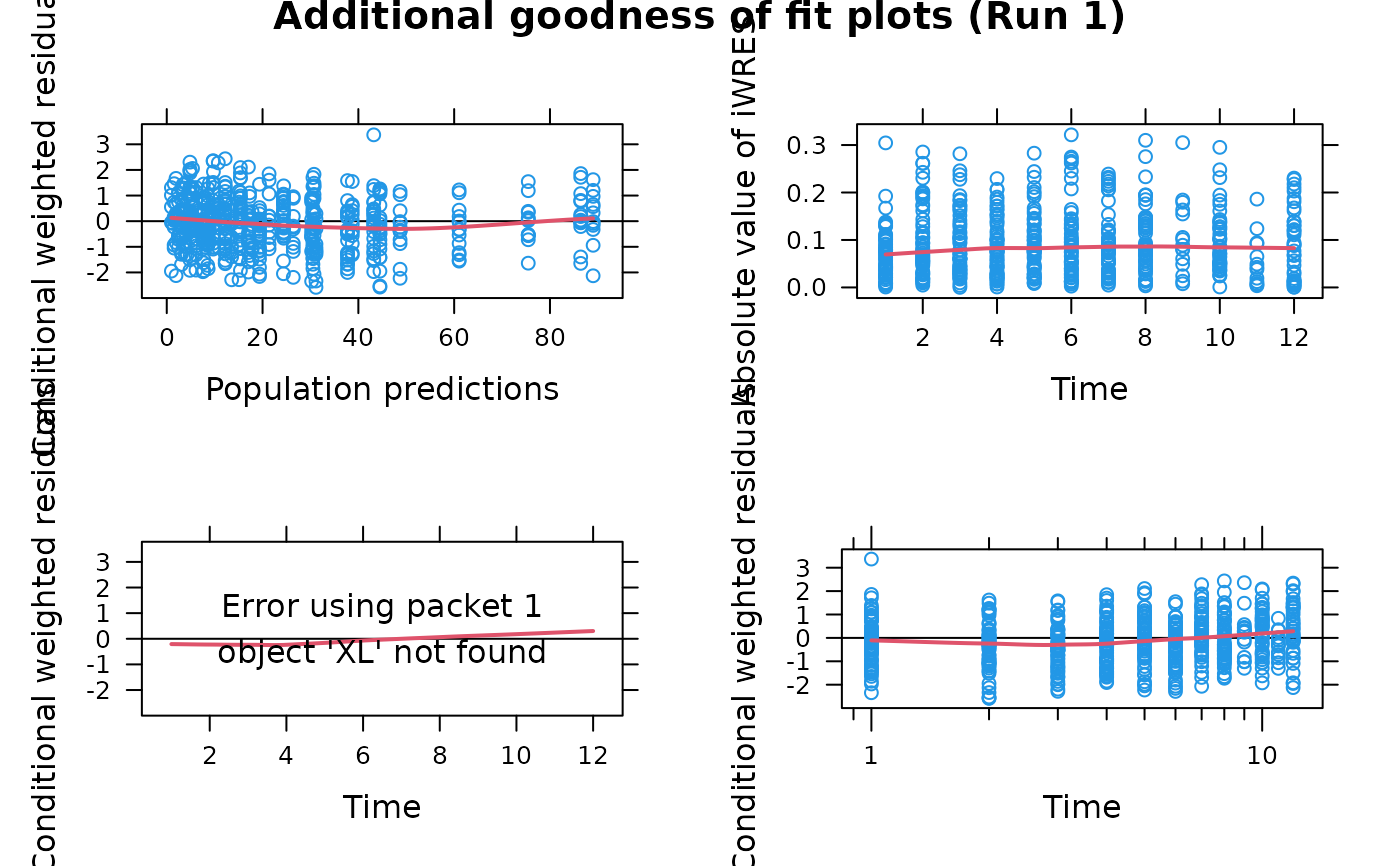
This is a compound plot consisting of plots of weighted population residuals
(WRES) vs population predictions (PRED), absolute individual weighted
residuals (|IWRES|) vs independent variable (IDV), WRES vs IDV, and weighted
population residuals vs log(IDV), a specific function in Xpose 4. It is a
wrapper encapsulating arguments to the wres.vs.pred,
iwres.vs.idv and wres.vs.idv functions.
Usage
addit.gof(
  object,
  type = "p",
  title.size = 0.02,
  title.just = c("center", "top"),
  main = "Default",
  force.wres = FALSE,
  ...
)
Arguments
- object
An xpose.data object.
- type
1-character string giving the type of plot desired. The following values are possible, for details, see 'plot': '"p"' for points, '"l"' for lines, '"o"' for over-plotted points and lines, '"b"', '"c"') for (empty if '"c"') points joined by lines, '"s"' and '"S"' for stair steps and '"h"' for histogram-like vertical lines. Finally, '"n"' does not produce any points or lines.
- title.size
Amount, in a range of 0-1, of how much space the title should take up in the plot)
- title.just
how the title should be justified
- main
The title of the plot. If
"Default"then a default title is plotted. Otherwise the value should be a string like"my title"orNULLfor no plot title.- force.wres
Plot the WRES even if other residuals are available.
- ...
Other arguments passed to
link{xpose.plot.default}.
Value
Returns a compound plot comprising plots of weighted population residuals (WRES) vs population predictions (PRED), absolute individual weighted residuals (|IWRES|) vs independent variable (IDV), WRES vs IDV, and weighted population residuals vs log(IDV).
Details
Four additional goodness-of-fit plots are presented side by side for comparison.
A wide array of extra options controlling xyplots are available. See
xpose.plot.default and
xpose.multiple.plot.default for details.
See also
wres.vs.pred, iwres.vs.idv,
wres.vs.idv, xpose.plot.default,
xpose.panel.default, xyplot,
xpose.prefs-class, xpose.data-class
Other specific functions:
absval.cwres.vs.cov.bw(),
absval.cwres.vs.pred(),
absval.cwres.vs.pred.by.cov(),
absval.iwres.cwres.vs.ipred.pred(),
absval.iwres.vs.cov.bw(),
absval.iwres.vs.idv(),
absval.iwres.vs.ipred(),
absval.iwres.vs.ipred.by.cov(),
absval.iwres.vs.pred(),
absval.wres.vs.cov.bw(),
absval.wres.vs.idv(),
absval.wres.vs.pred(),
absval.wres.vs.pred.by.cov(),
absval_delta_vs_cov_model_comp,
autocorr.cwres(),
autocorr.iwres(),
autocorr.wres(),
basic.gof(),
basic.model.comp(),
cat.dv.vs.idv.sb(),
cat.pc(),
cov.splom(),
cwres.dist.hist(),
cwres.dist.qq(),
cwres.vs.cov(),
cwres.vs.idv(),
cwres.vs.idv.bw(),
cwres.vs.pred(),
cwres.vs.pred.bw(),
cwres.wres.vs.idv(),
cwres.wres.vs.pred(),
dOFV.vs.cov(),
dOFV.vs.id(),
dOFV1.vs.dOFV2(),
data.checkout(),
dv.preds.vs.idv(),
dv.vs.idv(),
dv.vs.ipred(),
dv.vs.ipred.by.cov(),
dv.vs.ipred.by.idv(),
dv.vs.pred(),
dv.vs.pred.by.cov(),
dv.vs.pred.by.idv(),
dv.vs.pred.ipred(),
gof(),
ind.plots(),
ind.plots.cwres.hist(),
ind.plots.cwres.qq(),
ipred.vs.idv(),
iwres.dist.hist(),
iwres.dist.qq(),
iwres.vs.idv(),
kaplan.plot(),
par_cov_hist,
par_cov_qq,
parm.vs.cov(),
parm.vs.parm(),
pred.vs.idv(),
ranpar.vs.cov(),
runsum(),
wres.dist.hist(),
wres.dist.qq(),
wres.vs.idv(),
wres.vs.idv.bw(),
wres.vs.pred(),
wres.vs.pred.bw(),
xpose.VPC(),
xpose.VPC.both(),
xpose.VPC.categorical(),
xpose4-package