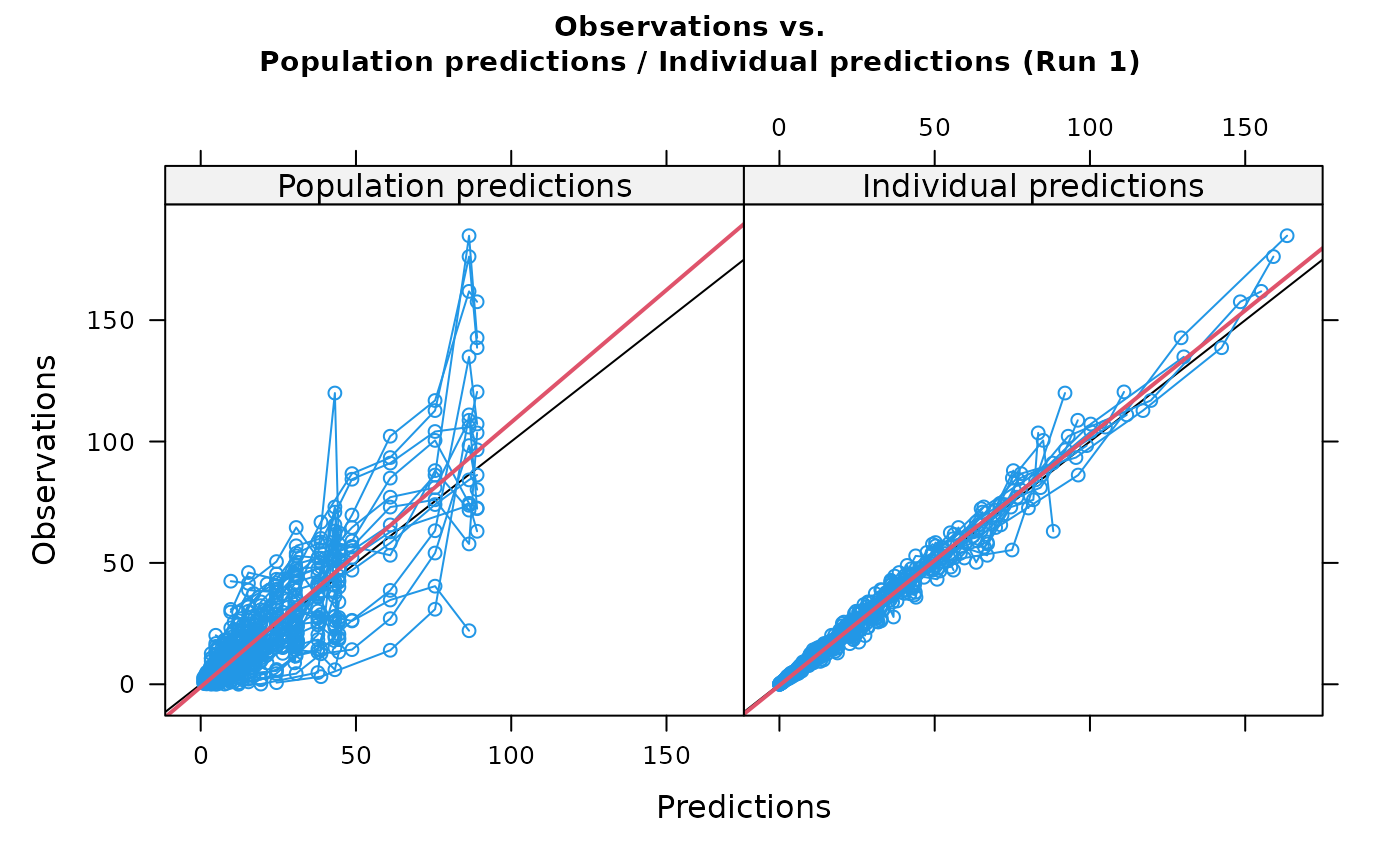
Observations (DV) are plotted against individual predictions (IPRED) and population predictions (PRED), for Xpose 4
Source:R/dv.vs.pred.ipred.R
dv.vs.pred.ipred.RdThis is a compound plot consisting of plots of observations (DV) against
individual predictions (IPRED) and population predictions (PRED), a specific
function in Xpose 4. It is a wrapper encapsulating arguments to the
xpose.plot.default function.
Arguments
- object
An xpose.data object.
- xlb
A string giving the label for the x-axis.
NULLif none.- layout
A list giving the layout of the graphs on the plot, in columns and rows.
- abline
Vector of arguments to the
panel.ablinefunction. No abline is drawn ifNULL.- lmline
logical variable specifying whether a linear regression line should be superimposed over an
xyplot.NULL~ FALSE. (y~x)- smooth
NULLorTRUEvalue indicating whether an x-y smooth should be superimposed.- scales
A list to be used for the
scalesargument inxyplot.- ...
Other arguments passed to
link{xpose.plot.default}.
Value
Returns a compound plot comprising plots of observations (DV) against individual predictions (IPRED) and population predictions (PRED).
Details
Plots of DV vs PRED and IPRED are presented side by side for comparison.
A wide array of extra options controlling xyplots are available. See
xpose.plot.default and xpose.panel.default for
details.
See also
dv.vs.pred, dv.vs.ipred,
xpose.plot.default, xpose.panel.default,
xyplot, xpose.prefs-class,
xpose.data-class
Other specific functions:
absval.cwres.vs.cov.bw(),
absval.cwres.vs.pred(),
absval.cwres.vs.pred.by.cov(),
absval.iwres.cwres.vs.ipred.pred(),
absval.iwres.vs.cov.bw(),
absval.iwres.vs.idv(),
absval.iwres.vs.ipred(),
absval.iwres.vs.ipred.by.cov(),
absval.iwres.vs.pred(),
absval.wres.vs.cov.bw(),
absval.wres.vs.idv(),
absval.wres.vs.pred(),
absval.wres.vs.pred.by.cov(),
absval_delta_vs_cov_model_comp,
addit.gof(),
autocorr.cwres(),
autocorr.iwres(),
autocorr.wres(),
basic.gof(),
basic.model.comp(),
cat.dv.vs.idv.sb(),
cat.pc(),
cov.splom(),
cwres.dist.hist(),
cwres.dist.qq(),
cwres.vs.cov(),
cwres.vs.idv(),
cwres.vs.idv.bw(),
cwres.vs.pred(),
cwres.vs.pred.bw(),
cwres.wres.vs.idv(),
cwres.wres.vs.pred(),
dOFV.vs.cov(),
dOFV.vs.id(),
dOFV1.vs.dOFV2(),
data.checkout(),
dv.preds.vs.idv(),
dv.vs.idv(),
dv.vs.ipred(),
dv.vs.ipred.by.cov(),
dv.vs.ipred.by.idv(),
dv.vs.pred(),
dv.vs.pred.by.cov(),
dv.vs.pred.by.idv(),
gof(),
ind.plots(),
ind.plots.cwres.hist(),
ind.plots.cwres.qq(),
ipred.vs.idv(),
iwres.dist.hist(),
iwres.dist.qq(),
iwres.vs.idv(),
kaplan.plot(),
par_cov_hist,
par_cov_qq,
parm.vs.cov(),
parm.vs.parm(),
pred.vs.idv(),
ranpar.vs.cov(),
runsum(),
wres.dist.hist(),
wres.dist.qq(),
wres.vs.idv(),
wres.vs.idv.bw(),
wres.vs.pred(),
wres.vs.pred.bw(),
xpose.VPC(),
xpose.VPC.both(),
xpose.VPC.categorical(),
xpose4-package