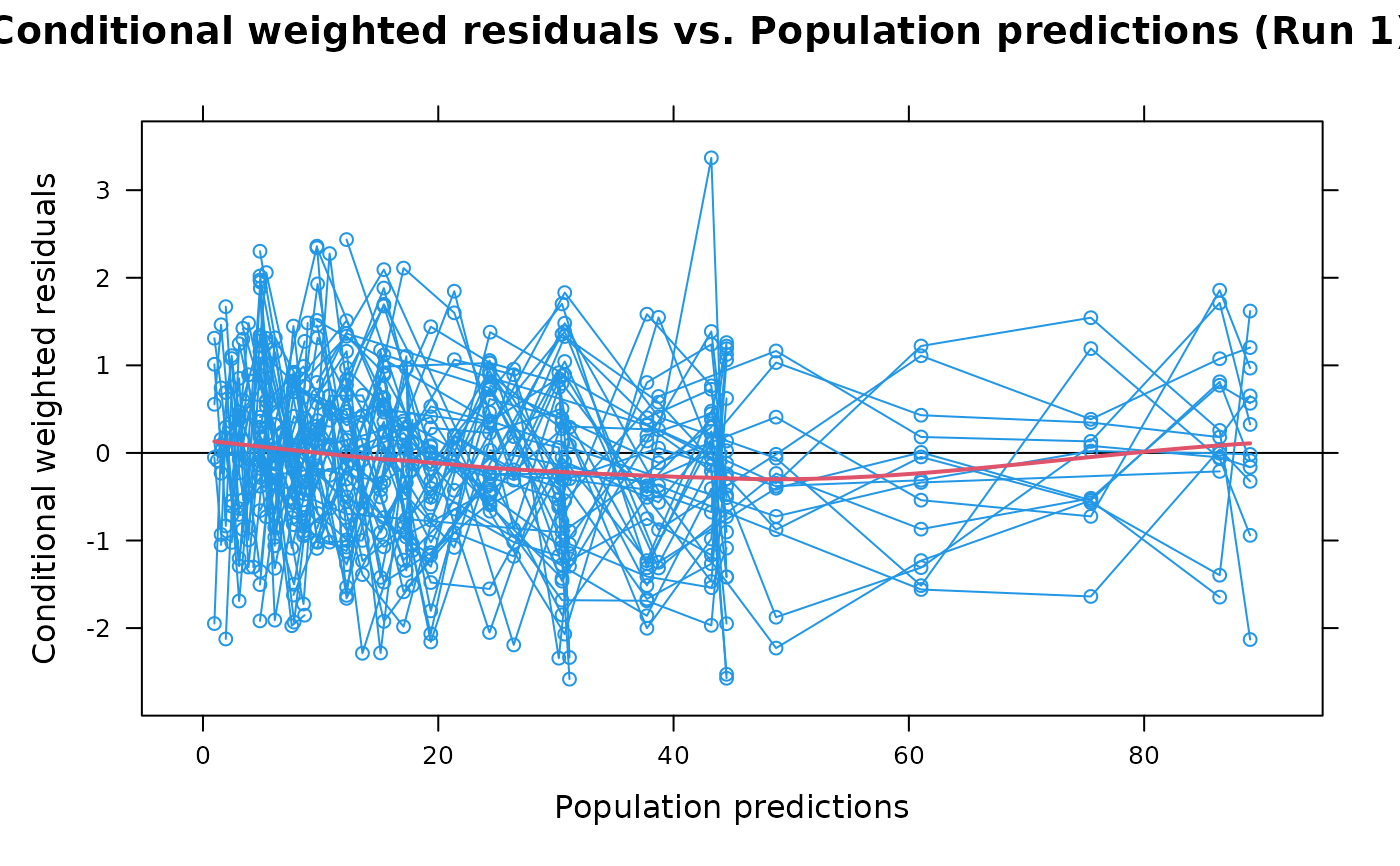
Population conditional weighted residuals (CWRES) plotted against population predictions (PRED) for Xpose 4
Source:R/cwres.vs.pred.R
cwres.vs.pred.RdThis is a plot of population conditional weighted residuals (cwres) vs
population predictions (PRED), a specific function in Xpose 4. It is a
wrapper encapsulating arguments to the xpose.plot.default function.
Most of the options take their default values from xpose.data object but may
be overridden by supplying them as arguments.
Usage
cwres.vs.pred(object, abline = c(0, 0), smooth = TRUE, ...)Arguments
- object
An xpose.data object.
- abline
Vector of arguments to the
panel.ablinefunction. No abline is drawn ifNULL.- smooth
Logical value indicating whether an x-y smooth should be superimposed. The default is TRUE.
- ...
Other arguments passed to
link{xpose.plot.default}.
Details
Conditional weighted residuals (CWRES) require some extra steps to
calculate. See compute.cwres for details.
A wide array of extra options controlling xyplots are available. See
xpose.plot.default and xpose.panel.default for
details.
See also
xpose.plot.default, xyplot,
xpose.prefs-class, compute.cwres,
xpose.data-class
Other specific functions:
absval.cwres.vs.cov.bw(),
absval.cwres.vs.pred(),
absval.cwres.vs.pred.by.cov(),
absval.iwres.cwres.vs.ipred.pred(),
absval.iwres.vs.cov.bw(),
absval.iwres.vs.idv(),
absval.iwres.vs.ipred(),
absval.iwres.vs.ipred.by.cov(),
absval.iwres.vs.pred(),
absval.wres.vs.cov.bw(),
absval.wres.vs.idv(),
absval.wres.vs.pred(),
absval.wres.vs.pred.by.cov(),
absval_delta_vs_cov_model_comp,
addit.gof(),
autocorr.cwres(),
autocorr.iwres(),
autocorr.wres(),
basic.gof(),
basic.model.comp(),
cat.dv.vs.idv.sb(),
cat.pc(),
cov.splom(),
cwres.dist.hist(),
cwres.dist.qq(),
cwres.vs.cov(),
cwres.vs.idv(),
cwres.vs.idv.bw(),
cwres.vs.pred.bw(),
cwres.wres.vs.idv(),
cwres.wres.vs.pred(),
dOFV.vs.cov(),
dOFV.vs.id(),
dOFV1.vs.dOFV2(),
data.checkout(),
dv.preds.vs.idv(),
dv.vs.idv(),
dv.vs.ipred(),
dv.vs.ipred.by.cov(),
dv.vs.ipred.by.idv(),
dv.vs.pred(),
dv.vs.pred.by.cov(),
dv.vs.pred.by.idv(),
dv.vs.pred.ipred(),
gof(),
ind.plots(),
ind.plots.cwres.hist(),
ind.plots.cwres.qq(),
ipred.vs.idv(),
iwres.dist.hist(),
iwres.dist.qq(),
iwres.vs.idv(),
kaplan.plot(),
par_cov_hist,
par_cov_qq,
parm.vs.cov(),
parm.vs.parm(),
pred.vs.idv(),
ranpar.vs.cov(),
runsum(),
wres.dist.hist(),
wres.dist.qq(),
wres.vs.idv(),
wres.vs.idv.bw(),
wres.vs.pred(),
wres.vs.pred.bw(),
xpose.VPC(),
xpose.VPC.both(),
xpose.VPC.categorical(),
xpose4-package