Histograms of weighted residuals for each individual in an Xpose data object, for Xpose 4
Source:R/ind.plots.cwres.hist.R, R/ind.plots.wres.hist.R
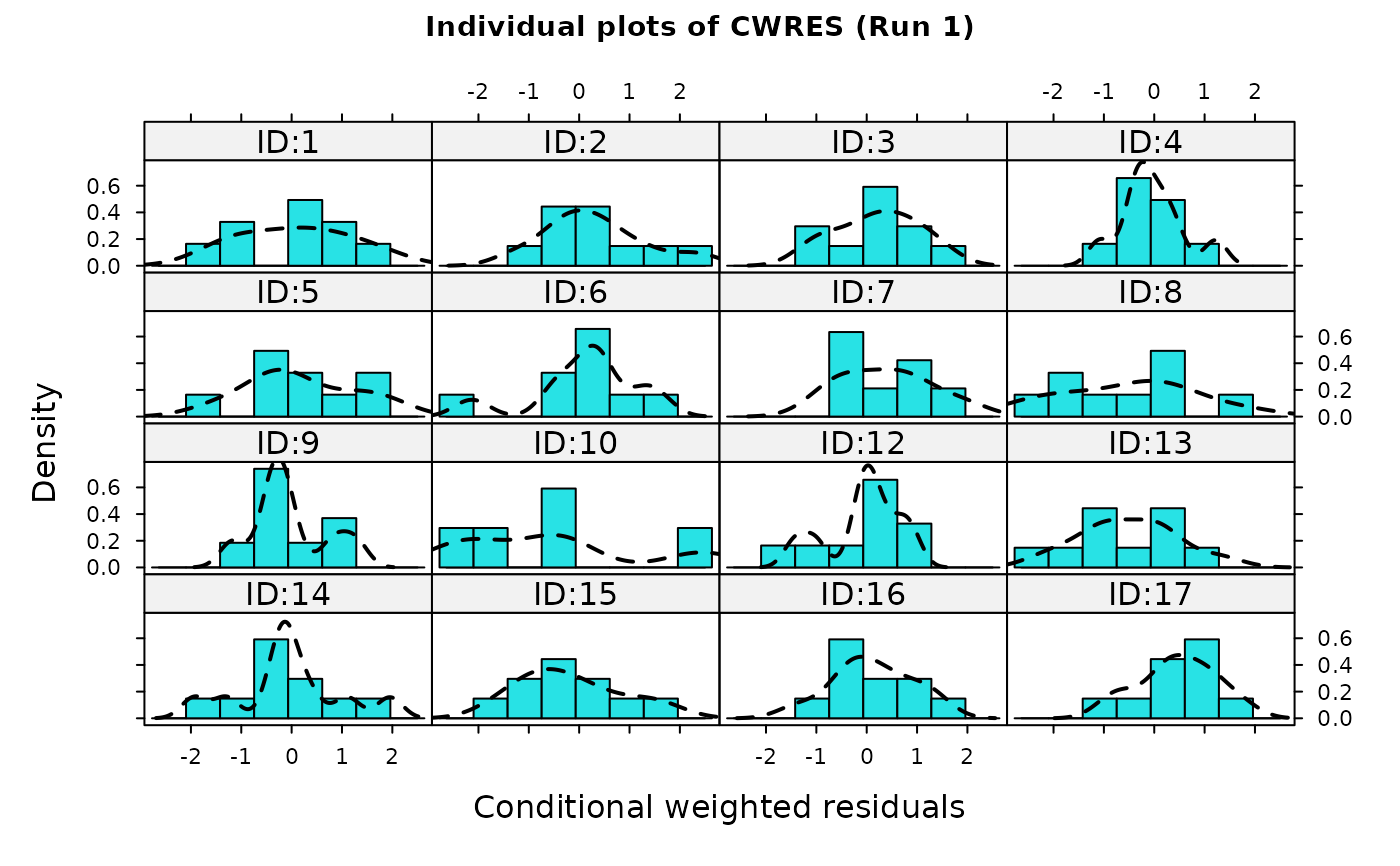
ind.plots.wres.hist.RdThis is a compound plot consisting of histograms of the distribution of
weighted residuals (any weighted residual available from NONMEM) for every
individual in the dataset. It is a wrapper encapsulating arguments to the
xpose.plot.histogram function.
Usage
ind.plots.cwres.hist(object, wres = "cwres", ...)

ind.plots.wres.hist(
  object,
  main = "Default",
  wres = "wres",
  ylb = NULL,
  layout = c(4, 4),
  inclZeroWRES = FALSE,
  subset = xsubset(object),
  scales = list(cex = 0.7, tck = 0.5),
  aspect = "fill",
  force.by.factor = TRUE,
  ids = F,
  as.table = TRUE,
  hicol = object@Prefs@Graph.prefs$hicol,
  hilty = object@Prefs@Graph.prefs$hilty,
  hilwd = object@Prefs@Graph.prefs$hilwd,
  hidcol = object@Prefs@Graph.prefs$hidcol,
  hidlty = object@Prefs@Graph.prefs$hidlty,
  hidlwd = object@Prefs@Graph.prefs$hidlwd,
  hiborder = object@Prefs@Graph.prefs$hiborder,
  prompt = FALSE,
  mirror = NULL,
  main.cex = 0.9,
  max.plots.per.page = 1,
  ...
)
Arguments
- object
An xpose.data object.
- wres
Which weighted residual should we plot? Defaults to the WRES.
- ...
Other arguments passed to
xpose.plot.histogram.- main
The title of the plot. If
"Default"then a default title is plotted. Otherwise the value should be a string like"my title"orNULLfor no plot title.- ylb
A string giving the label for the y-axis.
NULLif none.- layout
A list giving the layout of the graphs on the plot, in columns and rows. The default is 4x4.
- inclZeroWRES
Logical value indicating whether rows with WRES=0 is included in the plot. The default is FALSE.
- subset
A string giving the subset expression to be applied to the data before plotting. See
xsubset.- scales
- aspect
- force.by.factor
- ids
- as.table
- hicol
the fill colour of the histogram - an integer or string. The default is blue (see
histogram).- hilty
the border line type of the histogram - an integer. The default is 1 (see
histogram).- hilwd
the border line width of the histogram - an integer. The default is 1 (see
histogram).- hidcol
the fill colour of the density line - an integer or string. The default is black (see
histogram).- hidlty
the border line type of the density line - an integer. The default is 1 (see
histogram).- hidlwd
the border line width of the density line - an integer. The default is 1 (see
histogram).- hiborder
the border colour of the histogram - an integer or string. The default is black (see
histogram).- prompt
Specifies whether or not the user should be prompted to press RETURN between plot pages. Default is FALSE.
- mirror
Mirror plots are not yet implemented in this function and this argument must contain a value of
NULL- main.cex
The size of the title.
- max.plots.per.page
Maximum number of plots per page
Details
Matrices of histograms of weighted residuals in each included individual are
displayed. ind.plots.cwres.hist is just a wrapper for
ind.plots.wres.hist(object,wres="cwres").
See also
xpose.plot.histogram,
xpose.panel.histogram, histogram,
xpose.prefs-class, xpose.data-class
Other specific functions:
absval.cwres.vs.cov.bw(),
absval.cwres.vs.pred(),
absval.cwres.vs.pred.by.cov(),
absval.iwres.cwres.vs.ipred.pred(),
absval.iwres.vs.cov.bw(),
absval.iwres.vs.idv(),
absval.iwres.vs.ipred(),
absval.iwres.vs.ipred.by.cov(),
absval.iwres.vs.pred(),
absval.wres.vs.cov.bw(),
absval.wres.vs.idv(),
absval.wres.vs.pred(),
absval.wres.vs.pred.by.cov(),
absval_delta_vs_cov_model_comp,
addit.gof(),
autocorr.cwres(),
autocorr.iwres(),
autocorr.wres(),
basic.gof(),
basic.model.comp(),
cat.dv.vs.idv.sb(),
cat.pc(),
cov.splom(),
cwres.dist.hist(),
cwres.dist.qq(),
cwres.vs.cov(),
cwres.vs.idv(),
cwres.vs.idv.bw(),
cwres.vs.pred(),
cwres.vs.pred.bw(),
cwres.wres.vs.idv(),
cwres.wres.vs.pred(),
dOFV.vs.cov(),
dOFV.vs.id(),
dOFV1.vs.dOFV2(),
data.checkout(),
dv.preds.vs.idv(),
dv.vs.idv(),
dv.vs.ipred(),
dv.vs.ipred.by.cov(),
dv.vs.ipred.by.idv(),
dv.vs.pred(),
dv.vs.pred.by.cov(),
dv.vs.pred.by.idv(),
dv.vs.pred.ipred(),
gof(),
ind.plots(),
ind.plots.cwres.qq(),
ipred.vs.idv(),
iwres.dist.hist(),
iwres.dist.qq(),
iwres.vs.idv(),
kaplan.plot(),
par_cov_hist,
par_cov_qq,
parm.vs.cov(),
parm.vs.parm(),
pred.vs.idv(),
ranpar.vs.cov(),
runsum(),
wres.dist.hist(),
wres.dist.qq(),
wres.vs.idv(),
wres.vs.idv.bw(),
wres.vs.pred(),
wres.vs.pred.bw(),
xpose.VPC(),
xpose.VPC.both(),
xpose.VPC.categorical(),
xpose4-package