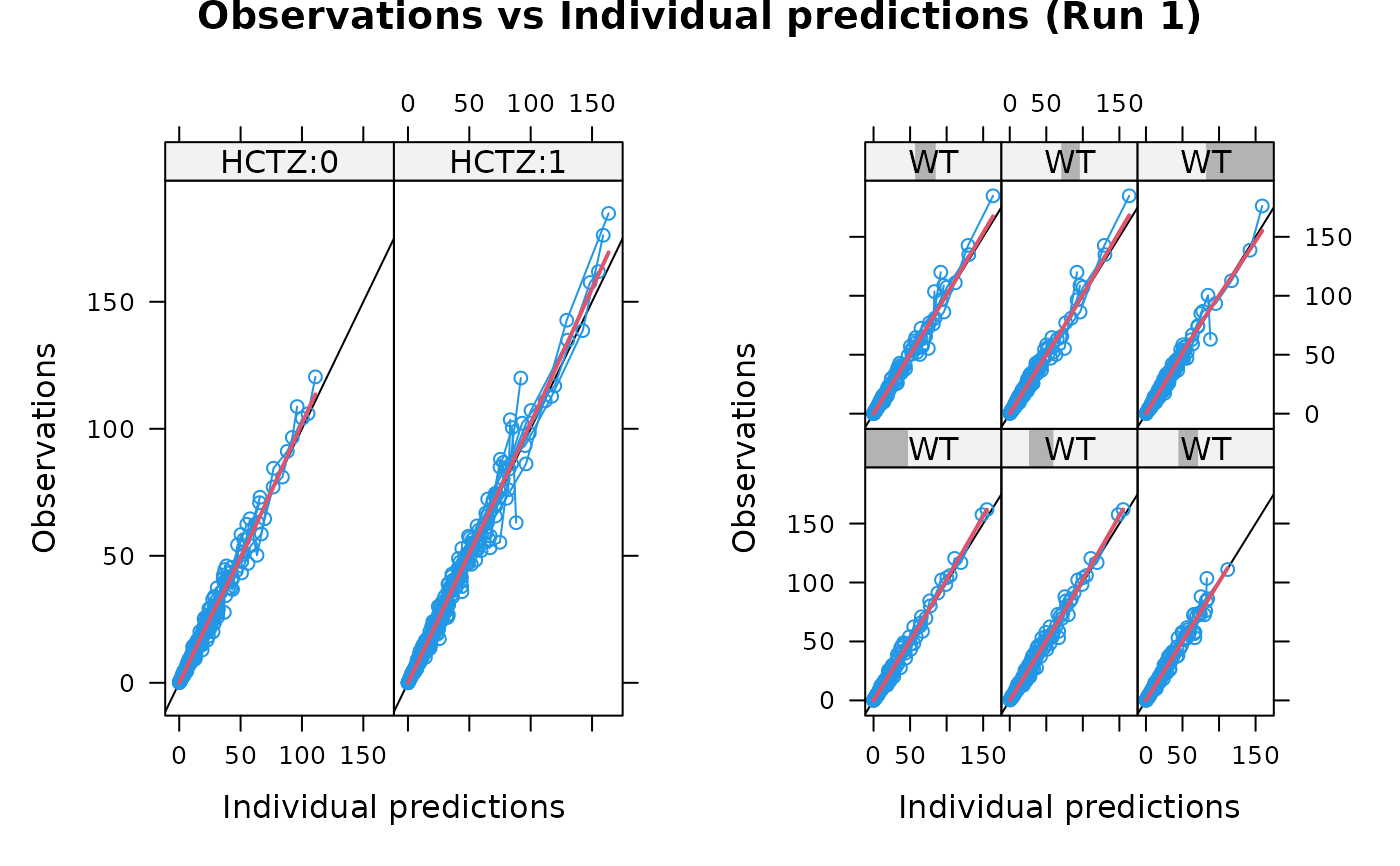
Dependent variable vs individual predictions, conditioned on covariates, for Xpose 4
Source:R/dv.vs.ipred.by.cov.R
dv.vs.ipred.by.cov.RdThis is a plot of dependent variable (DV) vs individual predictions (IPRED)
conditioned by covariates, a specific function in Xpose 4. It is a wrapper
encapsulating arguments to the xpose.plot.default function. Most of
the options take their default values from xpose.data object but may be
overridden by supplying them as arguments.
Usage
dv.vs.ipred.by.cov(
  object,
  covs = "Default",
  abline = c(0, 1),
  smooth = TRUE,
  main = "Default",
  ...
)
Arguments
- object
An xpose.data object.
- covs
A vector of covariates to use in the plot. If "Default" the the covariates defined in
object@Prefs@Xvardef$Covariatesare used.- abline
Vector of arguments to the
panel.ablinefunction. No abline is drawn ifNULL.- smooth
Logical value indicating whether an x-y smooth should be superimposed. The default is TRUE.
- main
The title of the plot. If
"Default"then a default title is plotted. Otherwise the value should be a string like"my title"orNULLfor no plot title.- ...
Other arguments passed to
link{xpose.plot.default}.
Details
Each of the covariates in the Xpose data object, as specified in
object@Prefs@Xvardef$Covariates, is evaluated in turn, creating a
stack of plots.
A wide array of extra options controlling xyplot are
available. See xpose.plot.default and
xpose.panel.default for details.
See also
dv.vs.ipred, xpose.plot.default,
xpose.panel.default, xyplot,
xpose.prefs-class, xpose.data-class
Other specific functions:
absval.cwres.vs.cov.bw(),
absval.cwres.vs.pred(),
absval.cwres.vs.pred.by.cov(),
absval.iwres.cwres.vs.ipred.pred(),
absval.iwres.vs.cov.bw(),
absval.iwres.vs.idv(),
absval.iwres.vs.ipred(),
absval.iwres.vs.ipred.by.cov(),
absval.iwres.vs.pred(),
absval.wres.vs.cov.bw(),
absval.wres.vs.idv(),
absval.wres.vs.pred(),
absval.wres.vs.pred.by.cov(),
absval_delta_vs_cov_model_comp,
addit.gof(),
autocorr.cwres(),
autocorr.iwres(),
autocorr.wres(),
basic.gof(),
basic.model.comp(),
cat.dv.vs.idv.sb(),
cat.pc(),
cov.splom(),
cwres.dist.hist(),
cwres.dist.qq(),
cwres.vs.cov(),
cwres.vs.idv(),
cwres.vs.idv.bw(),
cwres.vs.pred(),
cwres.vs.pred.bw(),
cwres.wres.vs.idv(),
cwres.wres.vs.pred(),
dOFV.vs.cov(),
dOFV.vs.id(),
dOFV1.vs.dOFV2(),
data.checkout(),
dv.preds.vs.idv(),
dv.vs.idv(),
dv.vs.ipred(),
dv.vs.ipred.by.idv(),
dv.vs.pred(),
dv.vs.pred.by.cov(),
dv.vs.pred.by.idv(),
dv.vs.pred.ipred(),
gof(),
ind.plots(),
ind.plots.cwres.hist(),
ind.plots.cwres.qq(),
ipred.vs.idv(),
iwres.dist.hist(),
iwres.dist.qq(),
iwres.vs.idv(),
kaplan.plot(),
par_cov_hist,
par_cov_qq,
parm.vs.cov(),
parm.vs.parm(),
pred.vs.idv(),
ranpar.vs.cov(),
runsum(),
wres.dist.hist(),
wres.dist.qq(),
wres.vs.idv(),
wres.vs.idv.bw(),
wres.vs.pred(),
wres.vs.pred.bw(),
xpose.VPC(),
xpose.VPC.both(),
xpose.VPC.categorical(),
xpose4-package
Examples
dv.vs.ipred.by.cov(simpraz.xpdb, covs=c("HCTZ","WT"), max.plots.per.page=2)