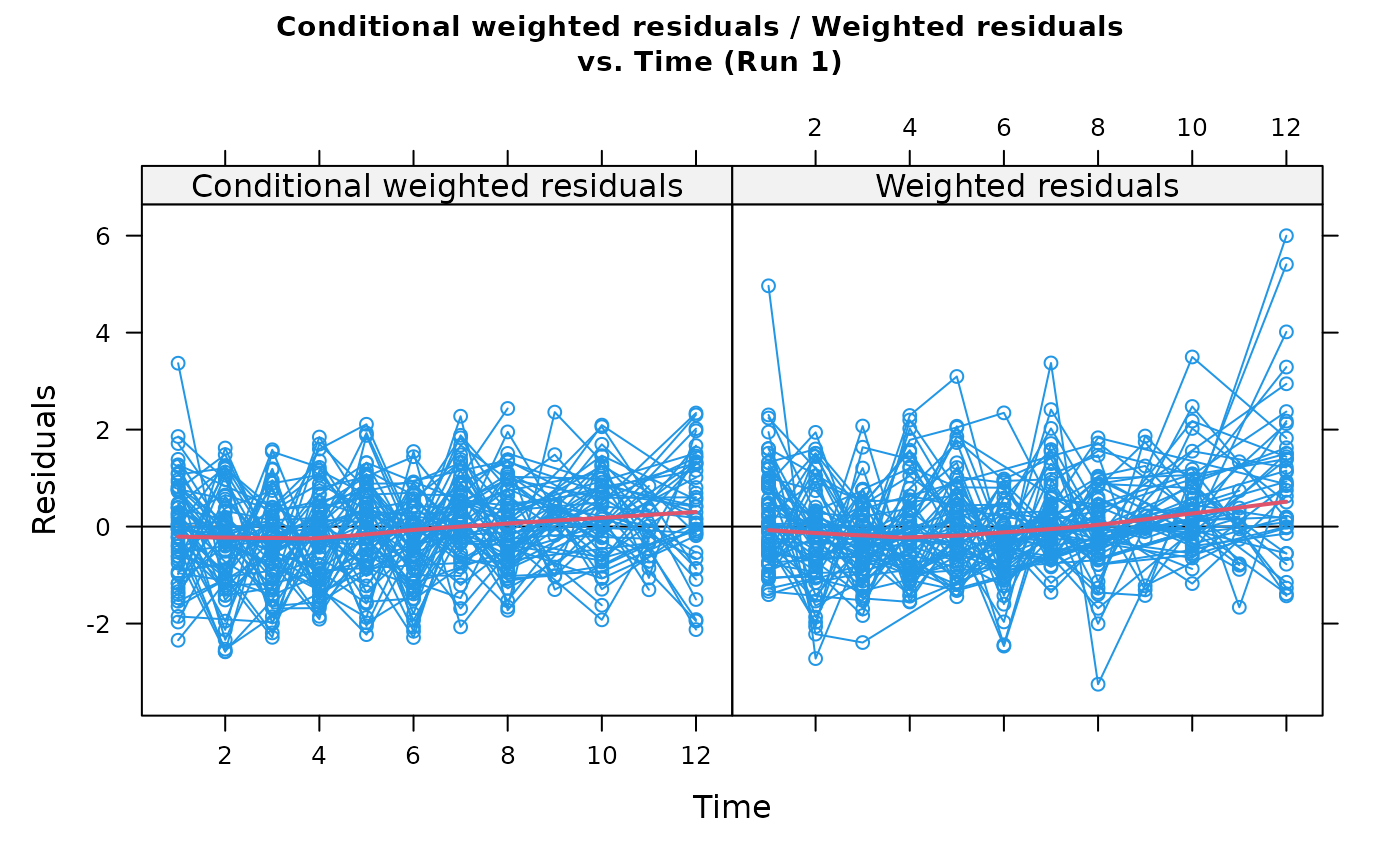
Weighted residuals (WRES) and conditional WRES (CWRES) plotted against the independent variable (IDV)
Source:R/cwres.wres.vs.idv.R
cwres.wres.vs.idv.RdA graphical comparison between the WRES and CWRES as plotted against the
independent variable. Conditional weighted residuals (CWRES) require
some extra steps to calculate. Either add CWRES to your NONMEM
table files or compute them using the information proveded in
compute.cwres. A wide array of extra options controlling
xyplots are available. See xpose.plot.default and
xpose.panel.default for details.
Arguments
- object
An xpose.data object.
- ylb
A string giving the label for the y-axis.
NULLif none.- abline
Vector of arguments to the
panel.ablinefunction. No abline is drawn ifNULL.- smooth
A
NULLvalue indicates that no superposed line should be added to the graph. IfTRUEthen a smooth of the data will be superimposed.- scales
scales is passed to
xpose.plot.default.- ...
Other arguments passed to
xpose.plot.default.
See also
xpose.plot.default,
xpose.panel.default, xyplot,
xpose.prefs-class, xpose.data-class,
compute.cwres
Other specific functions:
absval.cwres.vs.cov.bw(),
absval.cwres.vs.pred(),
absval.cwres.vs.pred.by.cov(),
absval.iwres.cwres.vs.ipred.pred(),
absval.iwres.vs.cov.bw(),
absval.iwres.vs.idv(),
absval.iwres.vs.ipred(),
absval.iwres.vs.ipred.by.cov(),
absval.iwres.vs.pred(),
absval.wres.vs.cov.bw(),
absval.wres.vs.idv(),
absval.wres.vs.pred(),
absval.wres.vs.pred.by.cov(),
absval_delta_vs_cov_model_comp,
addit.gof(),
autocorr.cwres(),
autocorr.iwres(),
autocorr.wres(),
basic.gof(),
basic.model.comp(),
cat.dv.vs.idv.sb(),
cat.pc(),
cov.splom(),
cwres.dist.hist(),
cwres.dist.qq(),
cwres.vs.cov(),
cwres.vs.idv(),
cwres.vs.idv.bw(),
cwres.vs.pred(),
cwres.vs.pred.bw(),
cwres.wres.vs.pred(),
dOFV.vs.cov(),
dOFV.vs.id(),
dOFV1.vs.dOFV2(),
data.checkout(),
dv.preds.vs.idv(),
dv.vs.idv(),
dv.vs.ipred(),
dv.vs.ipred.by.cov(),
dv.vs.ipred.by.idv(),
dv.vs.pred(),
dv.vs.pred.by.cov(),
dv.vs.pred.by.idv(),
dv.vs.pred.ipred(),
gof(),
ind.plots(),
ind.plots.cwres.hist(),
ind.plots.cwres.qq(),
ipred.vs.idv(),
iwres.dist.hist(),
iwres.dist.qq(),
iwres.vs.idv(),
kaplan.plot(),
par_cov_hist,
par_cov_qq,
parm.vs.cov(),
parm.vs.parm(),
pred.vs.idv(),
ranpar.vs.cov(),
runsum(),
wres.dist.hist(),
wres.dist.qq(),
wres.vs.idv(),
wres.vs.idv.bw(),
wres.vs.pred(),
wres.vs.pred.bw(),
xpose.VPC(),
xpose.VPC.both(),
xpose.VPC.categorical(),
xpose4-package