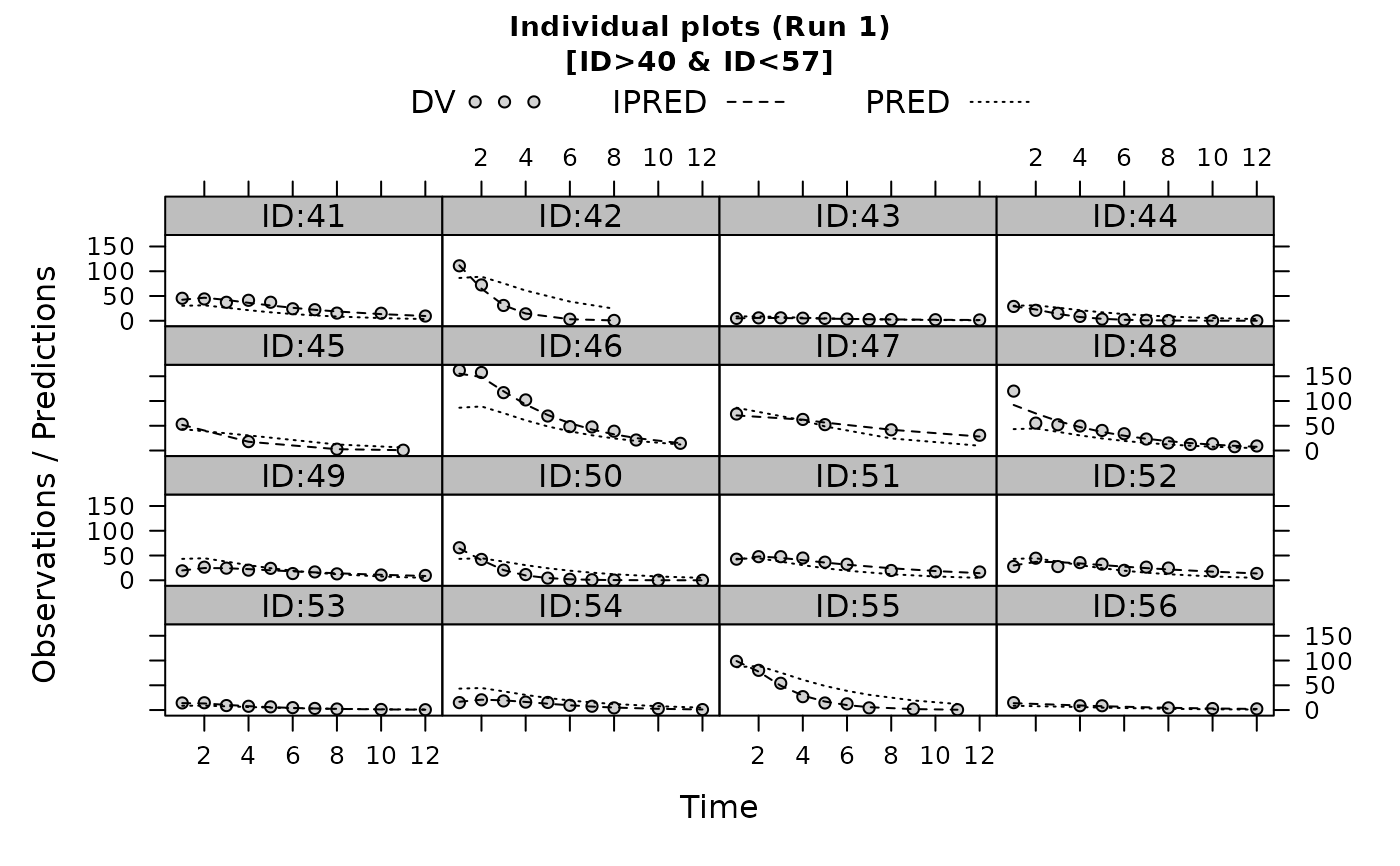
Observations (DV), individual predictions (IPRED) and population predictions (PRED) are plotted against the independent variable for every individual in the dataset, for Xpose 4
Source:R/ind.plots.R
ind.plots.RdThis is a compound plot consisting of plots of observations (DV), individual
predictions (IPRED) and population predictions (PRED) against the
independent variable for every individual in the dataset, a specific
function in Xpose 4. It is a wrapper encapsulating arguments to the
xpose.plot.default function.
Usage
ind.plots(
  object,
  y.vals = c(xvardef("dv", new.obj), xvardef("ipred", new.obj), xvardef("pred", new.obj)),
  x.vals = xvardef("idv", new.obj),
  id.vals = xvardef("id", new.obj),
  key.text = y.vals,
  main = "Default",
  key = "Default",
  xlb = xlabel(xvardef("idv", object), object),
  ylb = NULL,
  layout = c(4, 4),
  inclZeroWRES = FALSE,
  subset = xsubset(object),
  type = "o",
  grid = FALSE,
  col = c(1, 2, 4),
  lty = c(0, 1, 3),
  lwd = c(1, 1, 1),
  pch = c(21, 32, 32),
  cex = c(0.7, 0.7, 0.7),
  fill = c("lightgrey", 0, 0),
  prompt = FALSE,
  mirror = NULL,
  main.cex = 0.9,
  max.plots.per.page = 1,
  pch.ip.sp = c(21, 19, 18),
  cex.ip.sp = c(0.7, 0.4, 0.4),
  y.vals.subset = NULL,
  ...
)
Arguments
- object
An xpose.data object.
- y.vals
The Y values to use.
- x.vals
The X values to use.
- id.vals
The ID values to use.
- key.text
The text in the legend to use.
- main
The title of the plot. If
"Default"then a default title is plotted. Otherwise the value should be a string like"my title"orNULLfor no plot title.- key
Create a legend.
- xlb
A string giving the label for the x-axis.
NULLif none.- ylb
A string giving the label for the y-axis.
NULLif none.- layout
A list giving the layout of the graphs on the plot, in columns and rows. The default is 4x4.
- inclZeroWRES
Logical value indicating whether rows with WRES=0 is included in the plot. The default is TRUE.
- subset
A string giving the subset expression to be applied to the data before plotting. See
xsubset.- type
1-character string giving the type of plot desired. The default is "o", for over-plotted points and lines. See
xpose.plot.default.- grid
Should the plots have a grid in each plot?
- col
A list of three elements, giving plotting characters for observations, individual predictions, and population predictions, in that order. The default is black for DV, red for individual predictions, and blue for population predictions.
- lty
A list of three elements, giving line types for observations, individual predictions, and population predictions, in that order.
- lwd
A list of three elements, giving line widths for observations, individual predictions, and population predictions, in that order.
- pch
A list of three elements, giving plotting characters for observations, individual predictions, and population predictions, in that order.
- cex
A list of three elements, giving relative point size for observations, individual predictions, and population predictions, in that order. The default is c(0.7,0.7,0.7).
- fill
Fill the circles in the points?
- prompt
Specifies whether or not the user should be prompted to press RETURN between plot pages. Default is TRUE.
- mirror
Mirror plots are not yet implemented in this function and this argument must contain a value of
NULL- main.cex
The size of the title.
- max.plots.per.page
Maximum number of plots per page.
- pch.ip.sp
If there is a panel with just one observation then this specifies the type of points for the DV, IPRED and PRED respectively.
- cex.ip.sp
If there is a panel with just one observation then this specifies the size of the points for the DV, IPRED and PRED respectively.
- y.vals.subset
Used to subset on the DV, IPRED and PRED variables separately. Either
NULLor a vector of three strings, corresponding to the subset of DV, IPRED and PRED respectively. See examples below.- ...
Other arguments passed to
link{xpose.plot.default}.
Value
Returns a stack of plots observations (DV) against individual predictions (IPRED) and population predictions (PRED).
A wide array of extra options controlling xyplots are available. See
xpose.plot.default and xpose.panel.default for
details.
See also
xpose.plot.default,
xpose.panel.default, xyplot,
strip.default, xpose.prefs-class,
xpose.data-class
Other specific functions:
absval.cwres.vs.cov.bw(),
absval.cwres.vs.pred(),
absval.cwres.vs.pred.by.cov(),
absval.iwres.cwres.vs.ipred.pred(),
absval.iwres.vs.cov.bw(),
absval.iwres.vs.idv(),
absval.iwres.vs.ipred(),
absval.iwres.vs.ipred.by.cov(),
absval.iwres.vs.pred(),
absval.wres.vs.cov.bw(),
absval.wres.vs.idv(),
absval.wres.vs.pred(),
absval.wres.vs.pred.by.cov(),
absval_delta_vs_cov_model_comp,
addit.gof(),
autocorr.cwres(),
autocorr.iwres(),
autocorr.wres(),
basic.gof(),
basic.model.comp(),
cat.dv.vs.idv.sb(),
cat.pc(),
cov.splom(),
cwres.dist.hist(),
cwres.dist.qq(),
cwres.vs.cov(),
cwres.vs.idv(),
cwres.vs.idv.bw(),
cwres.vs.pred(),
cwres.vs.pred.bw(),
cwres.wres.vs.idv(),
cwres.wres.vs.pred(),
dOFV.vs.cov(),
dOFV.vs.id(),
dOFV1.vs.dOFV2(),
data.checkout(),
dv.preds.vs.idv(),
dv.vs.idv(),
dv.vs.ipred(),
dv.vs.ipred.by.cov(),
dv.vs.ipred.by.idv(),
dv.vs.pred(),
dv.vs.pred.by.cov(),
dv.vs.pred.by.idv(),
dv.vs.pred.ipred(),
gof(),
ind.plots.cwres.hist(),
ind.plots.cwres.qq(),
ipred.vs.idv(),
iwres.dist.hist(),
iwres.dist.qq(),
iwres.vs.idv(),
kaplan.plot(),
par_cov_hist,
par_cov_qq,
parm.vs.cov(),
parm.vs.parm(),
pred.vs.idv(),
ranpar.vs.cov(),
runsum(),
wres.dist.hist(),
wres.dist.qq(),
wres.vs.idv(),
wres.vs.idv.bw(),
wres.vs.pred(),
wres.vs.pred.bw(),
xpose.VPC(),
xpose.VPC.both(),
xpose.VPC.categorical(),
xpose4-package
Examples
## Here we load the example xpose database
xpdb <- simpraz.xpdb

## Monochrome, suitable for manuscript or report
ind.plots(xpdb,
  subset="ID>40 & ID<57",
  col=c(1,1,1),
  lty=c(0,2,3),
  strip=function(..., bg)
    strip.default(..., bg="grey"))


if (FALSE) { # \dontrun{
## IF we simulate in NONMEM using a dense grid of time points
## and all non-observed DV items are equal to zero.
ind.plots(xpdb,inclZeroWRES=TRUE,y.vals.subset=c("DV!=0","NULL","NULL"))


# to plot individual plots of multiple variables
ind.plots(xpdb,subset="FLAG==1")
ind.plots(xpdb,subset="FLAG==2")
} # }
if (FALSE) { # \dontrun{
## IF we simulate in NONMEM using a dense grid of time points
## and all non-observed DV items are equal to zero.
ind.plots(xpdb,inclZeroWRES=TRUE,y.vals.subset=c("DV!=0","NULL","NULL"))
# to plot individual plots of multiple variables
ind.plots(xpdb,subset="FLAG==1")
ind.plots(xpdb,subset="FLAG==2")
} # }