This function explicitly draw an xpose_plot and interprets keywords contained in labels.
# S3 method for class 'xpose_plot'
print(x, page, ...)
Arguments
Examples
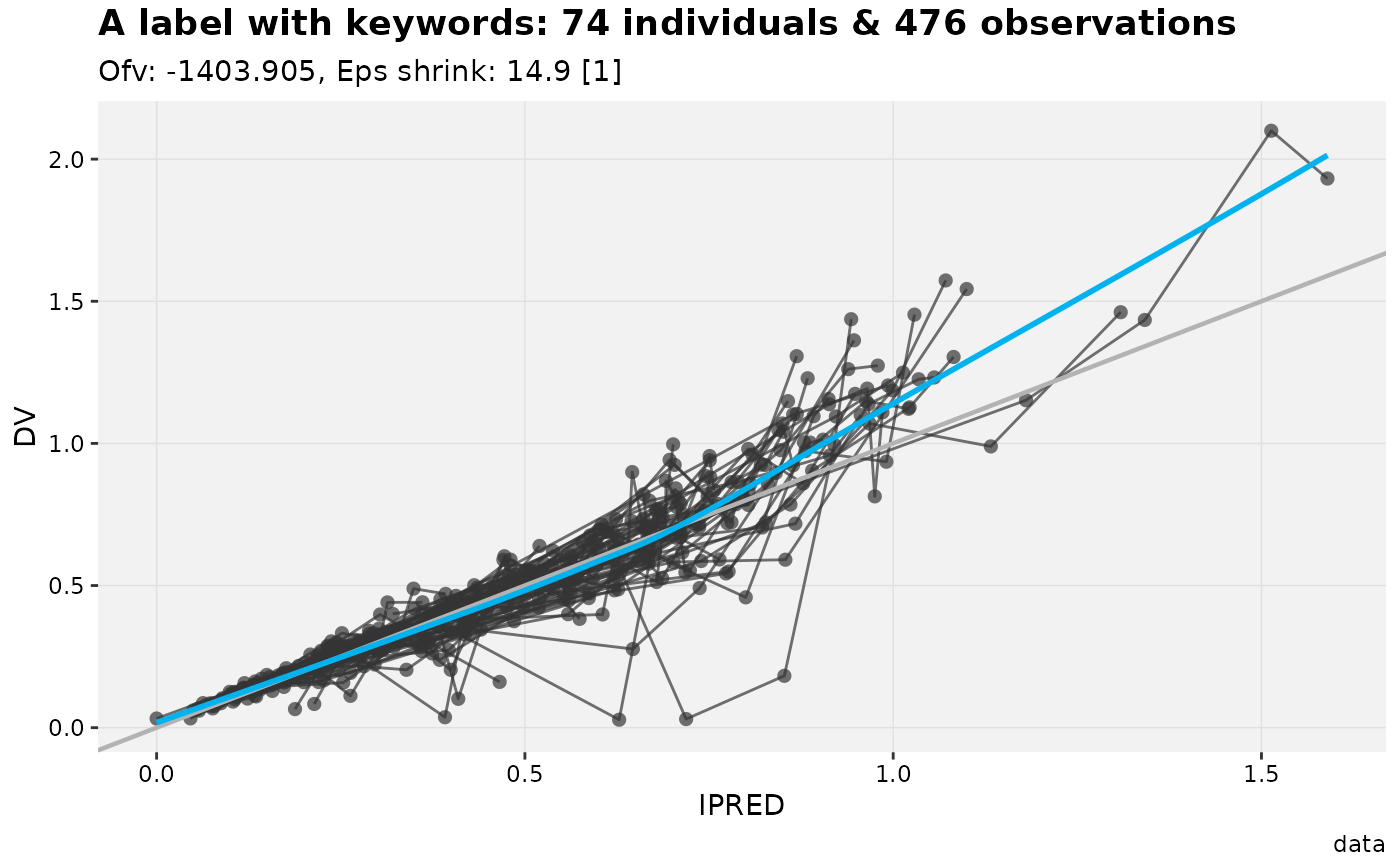
my_plot <- dv_vs_ipred(xpdb_ex_pk) +
            labs(title = 'A label with keywords: @nind individuals & @nobs observations')
#> Using data from $prob no.1
#> Filtering data by EVID == 0
# Using the print function
print(my_plot)
#> `geom_smooth()` using formula = 'y ~ x'


# Or simply by writing the plot object name
my_plot
#> `geom_smooth()` using formula = 'y ~ x'
# Or simply by writing the plot object name
my_plot
#> `geom_smooth()` using formula = 'y ~ x'